| Open: | 0.087972 |
| Change: | +0.005124 |
| Volume: | 0 |
| Low: | 0.087918 |
| High: | 0.093040 |
| High / Low range: | 0.005122 |
| Type: | Stocks |
| Ticker: | DVAX |
| ISIN: |
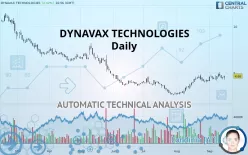
DYNAVAX TECHNOLOGIES - Daily - Technical analysis published on 09/17/2019 (GMT)
- 305
- 0
- 09/17/2019 - 17:13
- Who voted?
Click here for a new analysis!
- Timeframe : Daily
- - Analysis generated on 09/17/2019 - 17:13
- Status : INVALID

Summary of the analysis

Additional analysis
Quotes
The DYNAVAX TECHNOLOGIES rating is 4.66 USD. The price has increased by +2.42% since the last closing and was traded between 4.26 USD and 4.70 USD over the period. The price is currently at +9.39% from its lowest and -0.85% from its highest.The Central Gaps scanner detects a bearish opening. A small advantage for sellers in the very short term.
Bearish opening
Type : Bearish
Timeframe : Openning
Here is a more detailed summary of the historical variations registered by DYNAVAX TECHNOLOGIES:
Technical
Technical analysis of this Daily chart of DYNAVAX TECHNOLOGIES indicates that the overall trend is slightly bullish. Only 53.57% of the signals given by moving averages are bullish. This slightly bullish trend is reinforced by the strong signals currently being given by short-term moving averages. The Central Indicators scanner detects a bullish signal on moving averages that could impact this trend:
Bullish price crossover with Moving Average 100
Type : Bullish
Timeframe : Daily
In fact, 11 technical indicators on 18 studied are currently bullish. Caution: the Central Indicators scanner currently detects an excess:
Williams %R indicator is overbought : over -20
Type : Neutral
Timeframe : Daily
Pivot points : price is over resistance 1
Type : Neutral
Timeframe : Daily
MACD crosses DOWN its Moving Average
Type : Bearish
Timeframe : Daily
Ichimoku : price is over the cloud
Type : Bullish
Timeframe : Daily
Williams %R indicator is back over -50
Type : Bullish
Timeframe : Daily
Central Patterns, the market scanner focusing on chart patterns, resistances and supports found this result:
Horizontal resistance is broken
Type : Bullish
Timeframe : Daily
Central Candlesticks, the scanner specialised in Japanese candlesticks, detects a bullish signal that could support the hypothesis of a small rebound in the very short term:
Bullish harami
Type : Bullish
Timeframe : Daily
| S3 | S2 | S1 | Price | R1 | R2 | R3 | |
|---|---|---|---|---|---|---|---|
| ProTrendLines | 2.69 | 3.80 | 4.60 | 4.66 | 6.36 | 7.89 | 10.10 |
| Change (%) | -42.27% | -18.45% | -1.29% | - | +36.48% | +69.31% | +116.74% |
| Change | -1.97 | -0.86 | -0.06 | - | +1.70 | +3.23 | +5.44 |
| Level | Major | Major | Intermediate | - | Minor | Intermediate | Intermediate |
Pivot points can also be used to set your price objectives. Here is the price situation in relation to pivot points:
| Pivot points | S3 | S2 | S1 | PP | R1 | R2 | R3 |
|---|---|---|---|---|---|---|---|
| Standard | 4.09 | 4.20 | 4.37 | 4.48 | 4.65 | 4.76 | 4.93 |
| Camarilla | 4.47 | 4.50 | 4.52 | 4.55 | 4.58 | 4.60 | 4.63 |
| Woodie | 4.13 | 4.22 | 4.41 | 4.50 | 4.69 | 4.78 | 4.97 |
| Fibonacci | 4.20 | 4.30 | 4.37 | 4.48 | 4.58 | 4.65 | 4.76 |
| Pivot points | S3 | S2 | S1 | PP | R1 | R2 | R3 |
|---|---|---|---|---|---|---|---|
| Standard | 3.18 | 3.67 | 4.07 | 4.56 | 4.96 | 5.45 | 5.85 |
| Camarilla | 4.22 | 4.30 | 4.38 | 4.46 | 4.54 | 4.62 | 4.71 |
| Woodie | 3.13 | 3.65 | 4.02 | 4.54 | 4.91 | 5.43 | 5.80 |
| Fibonacci | 3.67 | 4.01 | 4.22 | 4.56 | 4.90 | 5.11 | 5.45 |
| Pivot points | S3 | S2 | S1 | PP | R1 | R2 | R3 |
|---|---|---|---|---|---|---|---|
| Standard | 0.77 | 1.71 | 2.93 | 3.87 | 5.09 | 6.03 | 7.25 |
| Camarilla | 3.55 | 3.74 | 3.94 | 4.14 | 4.34 | 4.54 | 4.73 |
| Woodie | 0.90 | 1.78 | 3.06 | 3.94 | 5.22 | 6.10 | 7.38 |
| Fibonacci | 1.71 | 2.54 | 3.05 | 3.87 | 4.70 | 5.21 | 6.03 |
Numerical data
The following are the details of the technical indicators and moving averages that were collected to generate this technical analysis:
| RSI (14): | 60.63 | |
| MACD (12,26,9): | 0.2300 | |
| Directional Movement: | 8.72 | |
| AROON (14): | 71.43 | |
| DEMA (21): | 4.68 | |
| Parabolic SAR (0,02-0,02-0,2): | 4.24 | |
| Elder Ray (13): | -0.02 | |
| Super Trend (3,10): | 3.75 | |
| Zig ZAG (10): | 4.67 | |
| VORTEX (21): | 1.0400 | |
| Stochastique (14,3,5): | 54.26 | |
| TEMA (21): | 4.80 | |
| Williams %R (14): | -33.64 | |
| Chande Momentum Oscillator (20): | 0.47 | |
| Repulse (5,40,3): | 8.1200 | |
| ROCnROLL: | 1 | |
| TRIX (15,9): | 0.9600 | |
| Courbe Coppock: | 16.17 |
| MA7: | 4.60 | |
| MA20: | 4.44 | |
| MA50: | 3.81 | |
| MA100: | 4.52 | |
| MAexp7: | 4.58 | |
| MAexp20: | 4.37 | |
| MAexp50: | 4.20 | |
| MAexp100: | 4.84 | |
| Price / MA7: | +1.30% | |
| Price / MA20: | +4.95% | |
| Price / MA50: | +22.31% | |
| Price / MA100: | +3.10% | |
| Price / MAexp7: | +1.75% | |
| Price / MAexp20: | +6.64% | |
| Price / MAexp50: | +10.95% | |
| Price / MAexp100: | -3.72% |
News
The latest news and videos published on DYNAVAX TECHNOLOGIES at the time of the analysis were as follows:
-
09/03/2019 - 22:05
 Dynavax Technologies Corporation - DVAX Stock Chart Technical Analysis for 09-03-2019
-
08/09/2019 - 21:43
Dynavax Technologies Corporation - DVAX Stock Chart Technical Analysis for 08-09-2019
-
06/17/2019 - 20:04
Dynavax Technologies Corporation - DVAX Stock Chart Technical Analysis for 06-17-2019
-
05/24/2019 - 22:04
Dynavax Technologies Corporation - DVAX Stock Chart Technical Analysis for 05-24-2019
-
05/09/2019 - 20:52
Dynavax Technologies Corporation - DVAX Stock Chart Technical Analysis for 05-09-2019
About author

Online


Add a comment
Comments
0 comments on the analysis DYNAVAX TECHNOLOGIES - Daily