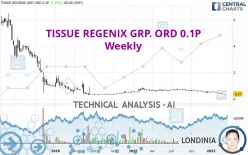
TISSUE REGENIX GRP. ORD 0.1P - Weekly - Technical analysis published on 03/11/2022 (GMT)
- 194
- 0
Click here for a new analysis!
- Timeframe : Weekly
- - Analysis generated on
- Status : INVALID

Summary of the analysis

Additional analysis
Quotes
The TISSUE REGENIX GRP. ORD 0.1P price is 0.370 GBX. The price is up +2.78% over 5 days and was traded between 0.330 GBX and 0.379 GBX over the period. The price is currently at +12.12% from its lowest point and -2.37% from its highest point.A bullish opening was detected by the Central Gaps scanner. Buyers are trying to impose a bullish momentum in the very short term.
Bullish opening
Type : Bullish
Timeframe : Openning
So that you have an overall view of the price change, here is a table showing the variations over several periods:
Near a new LOW record (1 year)
Type : Bearish
Timeframe : Weekly
Near a new LOW record (1st january)
Type : Bearish
Timeframe : Weekly
Near a new LOW record (1 month)
Type : Bearish
Timeframe : Weekly
Technical
Technical analysis of TISSUE REGENIX GRP. ORD 0.1P in Weekly shows a overall strongly bearish trend. The signals given by moving averages are 89.29% bearish. This strong bearish trend is confirmed by the strong signals currently being given by short-term moving averages. The Central Indicators market scanner currently does not detect any result that concerns moving averages.
An assessment of technical indicators does not currently provide any relevant information to suggest whether the signal given by the technical indicators is more bullish or bearish.
But beware of excesses. The Central Indicators scanner currently detects this:
CCI indicator is oversold : under -100
Type : Neutral
Timeframe : Weekly
Williams %R indicator is oversold : under -80
Type : Neutral
Timeframe : Weekly
Pivot points : price is over resistance 1
Type : Neutral
Timeframe : Weekly
The Central Patterns scanner, which studies chart patterns, resistances and supports, has identified this signal:
Horizontal resistance is broken
Type : Bullish
Timeframe : Weekly
The Central Candlesticks scanner which studies Japanese candlesticks did not detect anything.
| S1 | Price | R1 | R2 | R3 | |
|---|---|---|---|---|---|
| ProTrendLines | 0.302 | 0.370 | 5.650 | 7.275 | 8.250 |
| Change (%) | -18.38% | - | +1,427.03% | +1,866.22% | +2,129.73% |
| Change | -0.068 | - | +5.280 | +6.905 | +7.880 |
| Level | Major | - | Minor | Minor | Major |
To determine price objectives, it is also possible to use the pivot points. Here is the price position in relation to pivot points:
| Pivot points | S3 | S2 | S1 | PP | R1 | R2 | R3 |
|---|---|---|---|---|---|---|---|
| Standard | 0.328 | 0.337 | 0.353 | 0.362 | 0.378 | 0.387 | 0.403 |
| Camarilla | 0.363 | 0.365 | 0.368 | 0.370 | 0.372 | 0.375 | 0.377 |
| Woodie | 0.333 | 0.339 | 0.358 | 0.364 | 0.383 | 0.389 | 0.408 |
| Fibonacci | 0.337 | 0.346 | 0.352 | 0.362 | 0.371 | 0.377 | 0.387 |
| Pivot points | S3 | S2 | S1 | PP | R1 | R2 | R3 |
|---|---|---|---|---|---|---|---|
| Standard | 0.330 | 0.340 | 0.350 | 0.360 | 0.370 | 0.380 | 0.390 |
| Camarilla | 0.355 | 0.356 | 0.358 | 0.360 | 0.362 | 0.364 | 0.366 |
| Woodie | 0.330 | 0.340 | 0.350 | 0.360 | 0.370 | 0.380 | 0.390 |
| Fibonacci | 0.340 | 0.348 | 0.352 | 0.360 | 0.368 | 0.372 | 0.380 |
| Pivot points | S3 | S2 | S1 | PP | R1 | R2 | R3 |
|---|---|---|---|---|---|---|---|
| Standard | 0.183 | 0.267 | 0.313 | 0.397 | 0.443 | 0.527 | 0.573 |
| Camarilla | 0.324 | 0.336 | 0.348 | 0.360 | 0.372 | 0.384 | 0.396 |
| Woodie | 0.165 | 0.258 | 0.295 | 0.388 | 0.425 | 0.518 | 0.555 |
| Fibonacci | 0.267 | 0.316 | 0.347 | 0.397 | 0.446 | 0.477 | 0.527 |
Numerical data
The following is the status of the technical indicators and moving averages at the time of publication of this technical analysis:
| RSI (14): | 31.26 | |
| MACD (12,26,9): | -0.0620 | |
| Directional Movement: | -23.781 | |
| AROON (14): | -100.000 | |
| DEMA (21): | 0.409 | |
| Parabolic SAR (0,02-0,02-0,2): | 0.464 | |
| Elder Ray (13): | -0.095 | |
| Super Trend (3,10): | 0.522 | |
| Zig ZAG (10): | 0.370 | |
| VORTEX (21): | 0.7750 | |
| Stochastique (14,3,5): | 8.43 | |
| TEMA (21): | 0.369 | |
| Williams %R (14): | -83.26 | |
| Chande Momentum Oscillator (20): | -0.080 | |
| Repulse (5,40,3): | -5.3490 | |
| ROCnROLL: | 2 | |
| TRIX (15,9): | -1.1830 | |
| Courbe Coppock: | 52.95 |
| MA7: | 0.359 | |
| MA20: | 0.383 | |
| MA50: | 0.449 | |
| MA100: | 0.509 | |
| MAexp7: | 0.408 | |
| MAexp20: | 0.484 | |
| MAexp50: | 0.581 | |
| MAexp100: | 1.132 | |
| Price / MA7: | +3.06% | |
| Price / MA20: | -3.39% | |
| Price / MA50: | -17.59% | |
| Price / MA100: | -27.31% | |
| Price / MAexp7: | -9.31% | |
| Price / MAexp20: | -23.55% | |
| Price / MAexp50: | -36.32% | |
| Price / MAexp100: | -67.31% |
News
Don't forget to follow the news on TISSUE REGENIX GRP. ORD 0.1P. At the time of publication of this analysis, the latest news was as follows:
-
 Tissue Regenix present full year trading update, hailing a 13% increase in total revenues
- Hardman & Co Research: Tissue Regenix (TRX): Faster-than-anticipated recovery
-
Tissue Regenix delivers first-half results that show a strong recovery as it builds its portfolio
- Hardman & Co Research: Q&A with Dr Martin Hall on Tissue Regenix Group Plc: New capacity now on stream
- Hardman & Co Research: Tissue Regenix (TRX): Poised for growth
About author

Online


Add a comment
Comments
0 comments on the analysis TISSUE REGENIX GRP. ORD 0.1P - Weekly