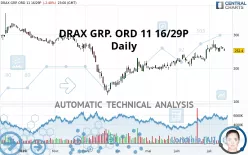
DRAX GRP. ORD 11 16/29P - Daily - Technical analysis published on 07/16/2020 (GMT)
- 420
- 0
- Who voted?
Click here for a new analysis!
- Timeframe : Daily
- - Analysis generated on
- Status : TARGET REACHED

Summary of the analysis

Additional analysis
Quotes
The DRAX GRP. ORD 11 16/29P price is 252.4 GBX. The price registered a decrease of -2.40% on the session and was between 251.2 GBX and 258.8 GBX. This implies that the price is at +0.48% from its lowest and at -2.47% from its highest.The Central Gaps scanner detects a bearish opening marking the presence of sellers ahead of buyers at the opening but not sufficiently marked to allow the price to register a quotation gap.
Bearish opening
Type : Bearish
Timeframe : Openning
So that you have an overall view of the price change, here is a table showing the variations over several periods:
Technical
Technical analysis of this Daily chart of DRAX GRP. ORD 11 16/29P indicates that the overall trend is strongly bullish. 82.14% of the signals given by moving averages are bullish. The overall trend is supported by the strong bullish signals from short-term moving averages. The Central Indicators market scanner currently does not detect any result that concerns moving averages.
In fact, according to the parameters integrated into the Central Analyzer system, 11 technical indicators out of 18 analysed are currently bullish. Caution: the Central Indicators scanner currently detects an excess:
Williams %R indicator is overbought : over -20
Type : Neutral
Timeframe : Daily
Pivot points : price is under support 1
Type : Neutral
Timeframe : Daily
Price is back over the pivot point
Type : Bullish
Timeframe : Daily
Price is back over the pivot point
Type : Bullish
Timeframe : Weekly
The analysis of the price chart with Central Patterns scanners does not return any result.
For a small rebound in the very short term, the Central Candlesticks scanner currently notes the presence of this bullish pattern in Japanese candlesticks:
Bullish engulfing lines
Type : Bullish
Timeframe : Daily
| S3 | S2 | S1 | Price | R1 | R2 | R3 | |
|---|---|---|---|---|---|---|---|
| ProTrendLines | 149.2 | 221.4 | 251.0 | 252.4 | 270.6 | 296.8 | 313.6 |
| Change (%) | -40.89% | -12.28% | -0.55% | - | +7.21% | +17.59% | +24.25% |
| Change | -103.2 | -31.0 | -1.4 | - | +18.2 | +44.4 | +61.2 |
| Level | Minor | Major | Major | - | Major | Intermediate | Minor |
Attention could also be paid to pivot points to set price objectives:
| Pivot points | S3 | S2 | S1 | PP | R1 | R2 | R3 |
|---|---|---|---|---|---|---|---|
| Standard | 239.5 | 244.7 | 252.3 | 257.5 | 265.1 | 270.3 | 277.9 |
| Camarilla | 256.5 | 257.7 | 258.8 | 260.0 | 261.2 | 262.4 | 263.5 |
| Woodie | 240.8 | 245.3 | 253.6 | 258.1 | 266.4 | 270.9 | 279.2 |
| Fibonacci | 244.7 | 249.6 | 252.6 | 257.5 | 262.4 | 265.4 | 270.3 |
| Pivot points | S3 | S2 | S1 | PP | R1 | R2 | R3 |
|---|---|---|---|---|---|---|---|
| Standard | 200.0 | 214.0 | 242.0 | 256.0 | 284.0 | 298.0 | 326.0 |
| Camarilla | 258.5 | 262.3 | 266.2 | 270.0 | 273.9 | 277.7 | 281.6 |
| Woodie | 207.0 | 217.5 | 249.0 | 259.5 | 291.0 | 301.5 | 333.0 |
| Fibonacci | 214.0 | 230.0 | 240.0 | 256.0 | 272.0 | 282.0 | 298.0 |
| Pivot points | S3 | S2 | S1 | PP | R1 | R2 | R3 |
|---|---|---|---|---|---|---|---|
| Standard | 155.1 | 180.1 | 218.7 | 243.7 | 282.3 | 307.3 | 345.9 |
| Camarilla | 239.7 | 245.5 | 251.4 | 257.2 | 263.0 | 268.9 | 274.7 |
| Woodie | 161.8 | 183.5 | 225.4 | 247.1 | 289.0 | 310.7 | 352.6 |
| Fibonacci | 180.1 | 204.4 | 219.4 | 243.7 | 268.0 | 283.0 | 307.3 |
Numerical data
The following are the details of the technical indicators and moving averages that were collected to generate this technical analysis:
| RSI (14): | 63.90 | |
| MACD (12,26,9): | 11.1000 | |
| Directional Movement: | 13.1 | |
| AROON (14): | 42.9 | |
| DEMA (21): | 263.1 | |
| Parabolic SAR (0,02-0,02-0,2): | 281.2 | |
| Elder Ray (13): | 6.7 | |
| Super Trend (3,10): | 231.1 | |
| Zig ZAG (10): | 264.2 | |
| VORTEX (21): | 1.2000 | |
| Stochastique (14,3,5): | 62.10 | |
| TEMA (21): | 266.3 | |
| Williams %R (14): | -29.20 | |
| Chande Momentum Oscillator (20): | 38.2 | |
| Repulse (5,40,3): | 3.5000 | |
| ROCnROLL: | 1 | |
| TRIX (15,9): | 0.7000 | |
| Courbe Coppock: | 27.20 |
| MA7: | 261.9 | |
| MA20: | 246.9 | |
| MA50: | 225.6 | |
| MA100: | 214.9 | |
| MAexp7: | 259.2 | |
| MAexp20: | 248.6 | |
| MAexp50: | 233.1 | |
| MAexp100: | 231.8 | |
| Price / MA7: | -3.63% | |
| Price / MA20: | +2.23% | |
| Price / MA50: | +11.88% | |
| Price / MA100: | +17.45% | |
| Price / MAexp7: | -2.62% | |
| Price / MAexp20: | +1.53% | |
| Price / MAexp50: | +8.28% | |
| Price / MAexp100: | +8.89% |
About author

Online


Add a comment
Comments
0 comments on the analysis DRAX GRP. ORD 11 16/29P - Daily