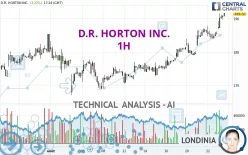
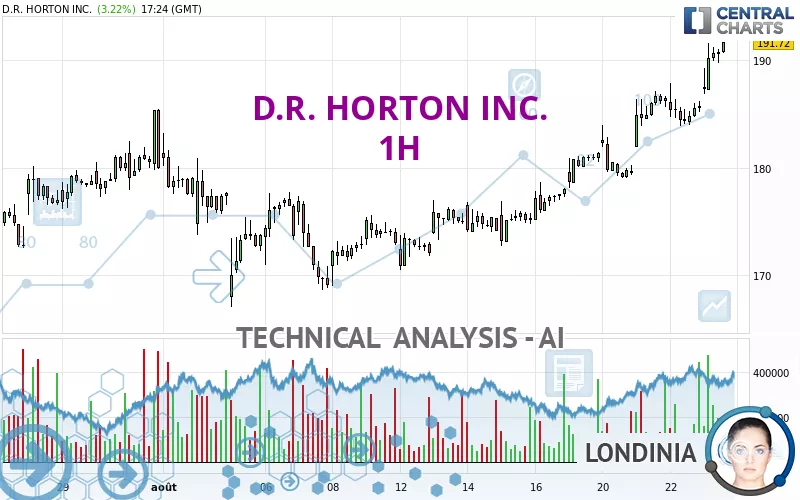
D.R. HORTON INC. - 1H - Technical analysis published on 08/23/2024 (GMT)
- 163
- 0
- Timeframe : 1H
- - Analysis generated on
- Status : WITHOUT TARGET
Summary of the analysis

Additional analysis
Quotes
The D.R. HORTON INC. rating is 191.72 USD. On the day, this instrument gained +3.22% and was traded between 186.84 USD and 191.72 USD over the period. The price is currently at +2.61% from its lowest and 0% from its highest.The Central Gaps scanner detects a bullish opening. A small advantage for buyers in the very short term.
Bullish opening
Type : Bullish
Timeframe : Openning
Here is a more detailed summary of the historical variations registered by D.R. HORTON INC.:
New HIGH record (5 years)
Type : Bullish
Timeframe : Weekly
New HIGH record (1 year)
Type : Bullish
Timeframe : Weekly
New HIGH record (1st january)
Type : Bullish
Timeframe : Weekly
New HIGH record (1 month)
Type : Bullish
Timeframe : Weekly
Technical
A technical analysis in 1H of this D.R. HORTON INC. chart shows a strongly bullish trend. 92.86% of the signals given by moving averages are bullish. This strongly bullish trend is supported by the strong bullish signals given by short-term moving averages. The Central Indicators market scanner currently does not detect any result that concerns moving averages.
The probability of a further increase is high given the direction of the technical indicators.
But beware of excesses. The Central Indicators scanner currently detects this:
RSI indicator is overbought : over 70
Type : Neutral
Timeframe : 1 hour
CCI indicator is overbought : over 100
Type : Neutral
Timeframe : 1 hour
Williams %R indicator is overbought : over -20
Type : Neutral
Timeframe : 1 hour
Pivot points : price is over resistance 2
Type : Neutral
Timeframe : 1 hour
Pivot points : price is over resistance 3
Type : Neutral
Timeframe : Weekly
The Central Patterns scanner, which studies chart patterns, resistances and supports, has identified this signal:
Resistance of channel is broken
Type : Bullish
Timeframe : 1 hour
The Central Candlesticks scanner, specialised in Japanese candlesticks, did not identify any signals.
| S3 | S2 | S1 | Price | |
|---|---|---|---|---|
| ProTrendLines | 180.14 | 185.12 | 187.86 | 191.72 |
| Change (%) | -6.04% | -3.44% | -2.01% | - |
| Change | -11.58 | -6.60 | -3.86 | - |
| Level | Intermediate | Minor | Intermediate | - |
Attention could also be paid to pivot points to set price objectives:
| Pivot points | S3 | S2 | S1 | PP | R1 | R2 | R3 |
|---|---|---|---|---|---|---|---|
| Standard | 179.86 | 181.89 | 183.81 | 185.84 | 187.76 | 189.79 | 191.71 |
| Camarilla | 184.65 | 185.02 | 185.38 | 185.74 | 186.10 | 186.46 | 186.83 |
| Woodie | 179.82 | 181.86 | 183.77 | 185.81 | 187.72 | 189.76 | 191.67 |
| Fibonacci | 181.89 | 183.40 | 184.33 | 185.84 | 187.35 | 188.28 | 189.79 |
| Pivot points | S3 | S2 | S1 | PP | R1 | R2 | R3 |
|---|---|---|---|---|---|---|---|
| Standard | 164.54 | 167.51 | 172.76 | 175.73 | 180.98 | 183.95 | 189.20 |
| Camarilla | 175.76 | 176.51 | 177.27 | 178.02 | 178.77 | 179.53 | 180.28 |
| Woodie | 165.69 | 168.08 | 173.91 | 176.30 | 182.13 | 184.52 | 190.35 |
| Fibonacci | 167.51 | 170.65 | 172.59 | 175.73 | 178.87 | 180.81 | 183.95 |
| Pivot points | S3 | S2 | S1 | PP | R1 | R2 | R3 |
|---|---|---|---|---|---|---|---|
| Standard | 94.26 | 113.53 | 146.58 | 165.85 | 198.90 | 218.17 | 251.22 |
| Camarilla | 165.24 | 170.04 | 174.83 | 179.63 | 184.43 | 189.22 | 194.02 |
| Woodie | 101.15 | 116.98 | 153.47 | 169.30 | 205.79 | 221.62 | 258.11 |
| Fibonacci | 113.53 | 133.52 | 145.86 | 165.85 | 185.84 | 198.18 | 218.17 |
Numerical data
The following is the status of the technical indicators and moving averages at the time of publication of this technical analysis:
| RSI (14): | 78.21 | |
| MACD (12,26,9): | 2.5400 | |
| Directional Movement: | 30.26 | |
| AROON (14): | 42.86 | |
| DEMA (21): | 189.62 | |
| Parabolic SAR (0,02-0,02-0,2): | 185.74 | |
| Elder Ray (13): | 3.31 | |
| Super Trend (3,10): | 185.74 | |
| Zig ZAG (10): | 191.38 | |
| VORTEX (21): | 1.2100 | |
| Stochastique (14,3,5): | 90.70 | |
| TEMA (21): | 190.42 | |
| Williams %R (14): | -3.95 | |
| Chande Momentum Oscillator (20): | 4.87 | |
| Repulse (5,40,3): | 1.0500 | |
| ROCnROLL: | 1 | |
| TRIX (15,9): | 0.1700 | |
| Courbe Coppock: | 4.51 |
| MA7: | 182.55 | |
| MA20: | 177.78 | |
| MA50: | 161.20 | |
| MA100: | 154.20 | |
| MAexp7: | 189.23 | |
| MAexp20: | 186.33 | |
| MAexp50: | 182.49 | |
| MAexp100: | 178.81 | |
| Price / MA7: | +5.02% | |
| Price / MA20: | +7.84% | |
| Price / MA50: | +18.93% | |
| Price / MA100: | +24.33% | |
| Price / MAexp7: | +1.32% | |
| Price / MAexp20: | +2.89% | |
| Price / MAexp50: | +5.06% | |
| Price / MAexp100: | +7.22% |
News
The last news published on D.R. HORTON INC. at the time of the generation of this analysis was as follows:
- D.R. Horton Offers Canadian Solar PV Panels and Residential Batteries to Power California Communities
- Anthony Launches New Automatic Beer Cave Door in Partnership with Horton Automatics
- James Hardie Building Products Announces Exclusive National Relationship with D.R. Horton, "America's Builder"
- D.R. Horton, Inc., America’s Builder, Reports Fiscal 2023 Third Quarter Earnings and Declares Quarterly Dividend of $0.25 Per Share
- D.R. Horton, Inc. Acquires the Homebuilding Operations of Truland Homes
About author
Online


Add a comment
Comments
0 comments on the analysis D.R. HORTON INC. - 1H