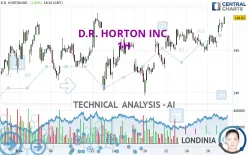
D.R. HORTON INC. - 1H - Technical analysis published on 02/29/2024 (GMT)
- 194
- 0
Click here for a new analysis!
- Timeframe : 1H
- - Analysis generated on
- Status : TARGET REACHED

Summary of the analysis

Additional analysis
Quotes
D.R. HORTON INC. rating 148.57 USD. The price has increased by +1.77% since the last closing and was traded between 146.86 USD and 148.99 USD over the period. The price is currently at +1.16% from its lowest and -0.28% from its highest.The Central Gaps scanner detects a bullish gap which is a sign that buyers have taken the lead in the very short term.
Opening Gap UP
Type : Bullish
Timeframe : Openning
A study of price movements over other periods shows the following variations:
Near a new LOW record (1 month)
Type : Bearish
Timeframe : Weekly
Technical
A technical analysis in 1H of this D.R. HORTON INC. chart shows a strongly bullish trend. 92.86% of the signals given by moving averages are bullish. This strongly bullish trend is supported by the strong bullish signals given by short-term moving averages. The Central Indicators scanner does not detect any result on moving averages that would impact this trend.
The probability of a further increase is high given the direction of the technical indicators.
But beware of excesses. The Central Indicators scanner currently detects this:
CCI indicator is overbought : over 100
Type : Neutral
Timeframe : 1 hour
Williams %R indicator is overbought : over -20
Type : Neutral
Timeframe : 1 hour
Pivot points : price is over resistance 2
Type : Neutral
Timeframe : 1 hour
An analysis of the price chart with the Central Patterns scanner (detector of chart patterns and resistances and supports) shows several results that can have an impact on the price change:
Near horizontal resistance
Type : Bearish
Timeframe : 1 hour
Resistance of channel is broken
Type : Bullish
Timeframe : 1 hour
No result was found by the Central Candlesticks scanner on Japanese candlesticks.
| S3 | S2 | S1 | Price | R1 | R2 | |
|---|---|---|---|---|---|---|
| ProTrendLines | 142.93 | 144.79 | 147.98 | 148.57 | 152.81 | 157.37 |
| Change (%) | -3.80% | -2.54% | -0.40% | - | +2.85% | +5.92% |
| Change | -5.64 | -3.78 | -0.59 | - | +4.24 | +8.80 |
| Level | Minor | Minor | Major | - | Minor | Major |
Pivot points can also be used to set your price objectives. Here is the price situation in relation to pivot points:
| Pivot points | S3 | S2 | S1 | PP | R1 | R2 | R3 |
|---|---|---|---|---|---|---|---|
| Standard | 143.11 | 144.03 | 145.00 | 145.92 | 146.89 | 147.81 | 148.78 |
| Camarilla | 145.46 | 145.63 | 145.81 | 145.98 | 146.15 | 146.33 | 146.50 |
| Woodie | 143.15 | 144.04 | 145.04 | 145.93 | 146.93 | 147.82 | 148.82 |
| Fibonacci | 144.03 | 144.75 | 145.20 | 145.92 | 146.64 | 147.09 | 147.81 |
| Pivot points | S3 | S2 | S1 | PP | R1 | R2 | R3 |
|---|---|---|---|---|---|---|---|
| Standard | 133.50 | 136.60 | 141.35 | 144.45 | 149.20 | 152.30 | 157.05 |
| Camarilla | 143.94 | 144.66 | 145.38 | 146.10 | 146.82 | 147.54 | 148.26 |
| Woodie | 134.33 | 137.01 | 142.18 | 144.86 | 150.03 | 152.71 | 157.88 |
| Fibonacci | 136.60 | 139.60 | 141.45 | 144.45 | 147.45 | 149.30 | 152.30 |
| Pivot points | S3 | S2 | S1 | PP | R1 | R2 | R3 |
|---|---|---|---|---|---|---|---|
| Standard | 115.84 | 127.19 | 134.90 | 146.25 | 153.96 | 165.31 | 173.02 |
| Camarilla | 137.37 | 139.12 | 140.86 | 142.61 | 144.36 | 146.10 | 147.85 |
| Woodie | 114.02 | 126.28 | 133.08 | 145.34 | 152.14 | 164.40 | 171.20 |
| Fibonacci | 127.19 | 134.47 | 138.97 | 146.25 | 153.53 | 158.03 | 165.31 |
Numerical data
The following is the status of technical indicators and moving averages registered at the time this technical analysis was created:
| RSI (14): | 67.10 | |
| MACD (12,26,9): | 0.6200 | |
| Directional Movement: | 14.03 | |
| AROON (14): | 92.86 | |
| DEMA (21): | 147.64 | |
| Parabolic SAR (0,02-0,02-0,2): | 146.06 | |
| Elder Ray (13): | 1.22 | |
| Super Trend (3,10): | 145.68 | |
| Zig ZAG (10): | 148.88 | |
| VORTEX (21): | 1.0600 | |
| Stochastique (14,3,5): | 91.14 | |
| TEMA (21): | 147.98 | |
| Williams %R (14): | -1.53 | |
| Chande Momentum Oscillator (20): | 3.46 | |
| Repulse (5,40,3): | 1.1200 | |
| ROCnROLL: | 1 | |
| TRIX (15,9): | 0.0300 | |
| Courbe Coppock: | 2.67 |
| MA7: | 145.87 | |
| MA20: | 145.17 | |
| MA50: | 147.43 | |
| MA100: | 133.36 | |
| MAexp7: | 147.76 | |
| MAexp20: | 146.90 | |
| MAexp50: | 146.09 | |
| MAexp100: | 145.69 | |
| Price / MA7: | +1.85% | |
| Price / MA20: | +2.34% | |
| Price / MA50: | +0.77% | |
| Price / MA100: | +11.41% | |
| Price / MAexp7: | +0.55% | |
| Price / MAexp20: | +1.14% | |
| Price / MAexp50: | +1.70% | |
| Price / MAexp100: | +1.98% |
News
The latest news and videos published on D.R. HORTON INC. at the time of the analysis were as follows:
- Anthony Launches New Automatic Beer Cave Door in Partnership with Horton Automatics
- James Hardie Building Products Announces Exclusive National Relationship with D.R. Horton, "America's Builder"
- D.R. Horton, Inc., America’s Builder, Reports Fiscal 2023 Third Quarter Earnings and Declares Quarterly Dividend of $0.25 Per Share
- D.R. Horton, Inc. Acquires the Homebuilding Operations of Truland Homes
- D.R. Horton, Inc. to Release 2023 Third Quarter Earnings on July 20, 2023
About author
Online


Add a comment
Comments
0 comments on the analysis D.R. HORTON INC. - 1H