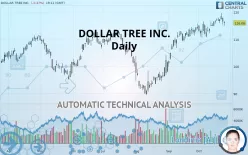
DOLLAR TREE INC. - Daily - Technical analysis published on 10/24/2019 (GMT)
- 419
- 0
- Who voted?
Click here for a new analysis!
- Timeframe : Daily
- - Analysis generated on
- Status : INVALID

Summary of the analysis

Additional analysis
Quotes
The DOLLAR TREE INC. price is 116.08 USD. On the day, this instrument lost -0.47% and was between 115.00 USD and 116.74 USD. This implies that the price is at +0.94% from its lowest and at -0.57% from its highest.A bearish opening was detected by the Central Gaps scanner. Sellers are trying to impose a bearish trend in the very short term.
Bearish opening
Type : Bearish
Timeframe : Openning
So that you have an overall view of the price change, here is a table showing the variations over several periods:
New HIGH record (5 years)
Type : Bullish
Timeframe : Weekly
Near a new HIGH record (1 year)
Type : Bullish
Timeframe : Weekly
Near a new HIGH record (1st january)
Type : Bullish
Timeframe : Weekly
Technical
A technical analysis in Daily of this DOLLAR TREE INC. chart shows a strongly bullish trend. 92.86% of the signals given by moving averages are bullish. The overall trend is supported by the strong bullish signals from short-term moving averages. The Central Indicators scanner does not detect any result on moving averages that would impact this trend.
In fact, only 8 technical indicators out of 18 studied are currently positioned bullish. Caution: the Central Indicators scanner currently detects an excess:
RSI indicator: bearish divergence
Type : Bearish
Timeframe : Daily
MACD crosses DOWN its Moving Average
Type : Bearish
Timeframe : Daily
Price is back over the pivot point
Type : Bullish
Timeframe : Weekly
Price is back under the pivot point
Type : Bearish
Timeframe : Daily
Central Patterns, the market scanner focusing on chart patterns, resistances and supports found these results:
Near horizontal resistance
Type : Bearish
Timeframe : Daily
Resistance of channel is broken
Type : Bullish
Timeframe : Daily
No result was found by the Central Candlesticks scanner on Japanese candlesticks.
| S3 | S2 | S1 | Price | R1 | |
|---|---|---|---|---|---|
| ProTrendLines | 95.29 | 107.39 | 112.59 | 116.08 | 116.35 |
| Change (%) | -17.91% | -7.49% | -3.01% | - | +0.23% |
| Change | -20.79 | -8.69 | -3.49 | - | +0.27 |
| Level | Intermediate | Minor | Intermediate | - | Major |
To determine price objectives, it is also possible to use the pivot points. Here is the price position in relation to pivot points:
| Pivot points | S3 | S2 | S1 | PP | R1 | R2 | R3 |
|---|---|---|---|---|---|---|---|
| Standard | 112.80 | 114.16 | 115.39 | 116.75 | 117.98 | 119.34 | 120.57 |
| Camarilla | 115.92 | 116.16 | 116.39 | 116.63 | 116.87 | 117.11 | 117.34 |
| Woodie | 112.75 | 114.13 | 115.34 | 116.72 | 117.93 | 119.31 | 120.52 |
| Fibonacci | 114.16 | 115.15 | 115.76 | 116.75 | 117.74 | 118.35 | 119.34 |
| Pivot points | S3 | S2 | S1 | PP | R1 | R2 | R3 |
|---|---|---|---|---|---|---|---|
| Standard | 112.15 | 113.54 | 115.26 | 116.65 | 118.37 | 119.76 | 121.48 |
| Camarilla | 116.13 | 116.41 | 116.70 | 116.98 | 117.27 | 117.55 | 117.84 |
| Woodie | 112.32 | 113.62 | 115.43 | 116.73 | 118.54 | 119.84 | 121.65 |
| Fibonacci | 113.54 | 114.73 | 115.46 | 116.65 | 117.84 | 118.57 | 119.76 |
| Pivot points | S3 | S2 | S1 | PP | R1 | R2 | R3 |
|---|---|---|---|---|---|---|---|
| Standard | 88.18 | 94.03 | 104.09 | 109.94 | 120.01 | 125.86 | 135.92 |
| Camarilla | 109.78 | 111.24 | 112.70 | 114.16 | 115.62 | 117.08 | 118.54 |
| Woodie | 90.29 | 95.08 | 106.20 | 111.00 | 122.12 | 126.91 | 138.03 |
| Fibonacci | 94.03 | 100.11 | 103.86 | 109.94 | 116.02 | 119.78 | 125.86 |
Numerical data
The following is the status of technical indicators and moving averages registered at the time this technical analysis was created:
| RSI (14): | 57.92 | |
| MACD (12,26,9): | 2.0400 | |
| Directional Movement: | 8.98 | |
| AROON (14): | 71.42 | |
| DEMA (21): | 117.82 | |
| Parabolic SAR (0,02-0,02-0,2): | 114.74 | |
| Elder Ray (13): | -0.03 | |
| Super Trend (3,10): | 112.36 | |
| Zig ZAG (10): | 116.06 | |
| VORTEX (21): | 1.0100 | |
| Stochastique (14,3,5): | 70.08 | |
| TEMA (21): | 117.61 | |
| Williams %R (14): | -41.18 | |
| Chande Momentum Oscillator (20): | 3.58 | |
| Repulse (5,40,3): | -0.3600 | |
| ROCnROLL: | 1 | |
| TRIX (15,9): | 0.3000 | |
| Courbe Coppock: | 5.92 |
| MA7: | 117.02 | |
| MA20: | 115.04 | |
| MA50: | 108.89 | |
| MA100: | 107.06 | |
| MAexp7: | 116.58 | |
| MAexp20: | 114.91 | |
| MAexp50: | 111.00 | |
| MAexp100: | 107.73 | |
| Price / MA7: | -0.80% | |
| Price / MA20: | +0.90% | |
| Price / MA50: | +6.60% | |
| Price / MA100: | +8.43% | |
| Price / MAexp7: | -0.43% | |
| Price / MAexp20: | +1.02% | |
| Price / MAexp50: | +4.58% | |
| Price / MAexp100: | +7.75% |
News
Don"t forget to follow the news on DOLLAR TREE INC.. At the time of publication of this analysis, the latest news was as follows:
About author

Online


Add a comment
Comments
0 comments on the analysis DOLLAR TREE INC. - Daily