| Open: | - |
| Change: | - |
| Volume: | - |
| Low: | - |
| High: | - |
| High / Low range: | - |
| Type: | Stocks |
| Ticker: | DLTR |
| ISIN: |
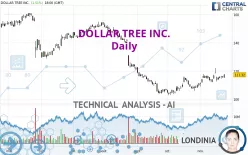
DOLLAR TREE INC. - Daily - Technical analysis published on 11/25/2023 (GMT)
- 232
- 0
- 11/25/2023 - 20:03
Click here for a new analysis!
- Timeframe : Daily
- - Analysis generated on 11/25/2023 - 20:03
- Status : TARGET REACHED

Summary of the analysis

Additional analysis
Quotes
The DOLLAR TREE INC. rating is 117.32 USD. The price has increased by +1.51% since the last closing and was traded between 115.03 USD and 117.64 USD over the period. The price is currently at +1.99% from its lowest and -0.27% from its highest.The Central Gaps scanner detects a bearish opening marking the presence of sellers ahead of buyers at the opening but not sufficiently marked to allow the price to register a quotation gap.
Bearish opening
Type : Bearish
Timeframe : Openning
A study of price movements over other periods shows the following variations:
Near a new HIGH record (1 month)
Type : Bullish
Timeframe : Weekly
Technical
Technical analysis of DOLLAR TREE INC. in Daily shows a neutral overall trend. The strong bullish signals currently being given by short-term moving averages could allow the overall trend to return to bullish. There is no crossing of moving average by the price or crossing of moving averages between themselves.
In fact, 12 technical indicators on 18 studied are currently bullish. Central Indicators, the scanner specialised in technical indicators, has identified these signals:
Pivot points : price is over resistance 2
Type : Neutral
Timeframe : Daily
Price is back over the pivot point
Type : Bullish
Timeframe : Weekly
Williams %R indicator is back over -50
Type : Bullish
Timeframe : Daily
The Central Patterns scanner, which studies chart patterns, resistances and supports, has identified this signal:
Near horizontal resistance
Type : Bearish
Timeframe : Daily
For a small rebound in the very short term, the Central Candlesticks scanner currently notes the presence of this bullish pattern in Japanese candlesticks:
Bullish engulfing lines
Type : Bullish
Timeframe : Daily
| S3 | S2 | S1 | Price | R1 | R2 | R3 | |
|---|---|---|---|---|---|---|---|
| ProTrendLines | 97.86 | 103.72 | 108.06 | 117.32 | 118.71 | 135.62 | 146.61 |
| Change (%) | -16.59% | -11.59% | -7.89% | - | +1.18% | +15.60% | +24.97% |
| Change | -19.46 | -13.60 | -9.26 | - | +1.39 | +18.30 | +29.29 |
| Level | Major | Intermediate | Minor | - | Major | Intermediate | Intermediate |
Attention could also be paid to pivot points to set price objectives:
| Pivot points | S3 | S2 | S1 | PP | R1 | R2 | R3 |
|---|---|---|---|---|---|---|---|
| Standard | 113.08 | 114.05 | 115.69 | 116.66 | 118.30 | 119.27 | 120.91 |
| Camarilla | 116.60 | 116.84 | 117.08 | 117.32 | 117.56 | 117.80 | 118.04 |
| Woodie | 113.41 | 114.22 | 116.02 | 116.83 | 118.63 | 119.44 | 121.24 |
| Fibonacci | 114.05 | 115.05 | 115.67 | 116.66 | 117.66 | 118.28 | 119.27 |
| Pivot points | S3 | S2 | S1 | PP | R1 | R2 | R3 |
|---|---|---|---|---|---|---|---|
| Standard | 112.18 | 113.33 | 115.33 | 116.48 | 118.48 | 119.63 | 121.63 |
| Camarilla | 116.45 | 116.74 | 117.03 | 117.32 | 117.61 | 117.90 | 118.19 |
| Woodie | 112.60 | 113.54 | 115.75 | 116.69 | 118.90 | 119.84 | 122.05 |
| Fibonacci | 113.33 | 114.54 | 115.28 | 116.48 | 117.69 | 118.43 | 119.63 |
| Pivot points | S3 | S2 | S1 | PP | R1 | R2 | R3 |
|---|---|---|---|---|---|---|---|
| Standard | 90.82 | 96.80 | 103.94 | 109.92 | 117.06 | 123.04 | 130.18 |
| Camarilla | 107.48 | 108.69 | 109.89 | 111.09 | 112.29 | 113.50 | 114.70 |
| Woodie | 91.41 | 97.09 | 104.53 | 110.21 | 117.65 | 123.33 | 130.77 |
| Fibonacci | 96.80 | 101.81 | 104.91 | 109.92 | 114.93 | 118.03 | 123.04 |
Numerical data
The following are the details of the technical indicators and moving averages that were collected to generate this technical analysis:
| RSI (14): | 58.05 | |
| MACD (12,26,9): | 1.2900 | |
| Directional Movement: | 7.34 | |
| AROON (14): | 14.28 | |
| DEMA (21): | 115.95 | |
| Parabolic SAR (0,02-0,02-0,2): | 110.80 | |
| Elder Ray (13): | 1.16 | |
| Super Trend (3,10): | 111.41 | |
| Zig ZAG (10): | 117.32 | |
| VORTEX (21): | 1.0900 | |
| Stochastique (14,3,5): | 43.13 | |
| TEMA (21): | 117.65 | |
| Williams %R (14): | -47.37 | |
| Chande Momentum Oscillator (20): | 0.99 | |
| Repulse (5,40,3): | 2.4600 | |
| ROCnROLL: | 1 | |
| TRIX (15,9): | 0.1700 | |
| Courbe Coppock: | 5.46 |
| MA7: | 116.00 | |
| MA20: | 114.29 | |
| MA50: | 110.56 | |
| MA100: | 124.90 | |
| MAexp7: | 115.90 | |
| MAexp20: | 114.40 | |
| MAexp50: | 115.27 | |
| MAexp100: | 121.71 | |
| Price / MA7: | +1.14% | |
| Price / MA20: | +2.65% | |
| Price / MA50: | +6.11% | |
| Price / MA100: | -6.07% | |
| Price / MAexp7: | +1.23% | |
| Price / MAexp20: | +2.55% | |
| Price / MAexp50: | +1.78% | |
| Price / MAexp100: | -3.61% |
News
Don't forget to follow the news on DOLLAR TREE INC.. At the time of publication of this analysis, the latest news was as follows:
- 05/25/2017 - 08:10 Investor Network: Dollar Tree, Inc. to Host Earnings Call
About author

Online


Add a comment
Comments
0 comments on the analysis DOLLAR TREE INC. - Daily