| Open: | - |
| Change: | - |
| Volume: | - |
| Low: | - |
| High: | - |
| High / Low range: | - |
| Type: | Stocks |
| Ticker: | DG |
| ISIN: |
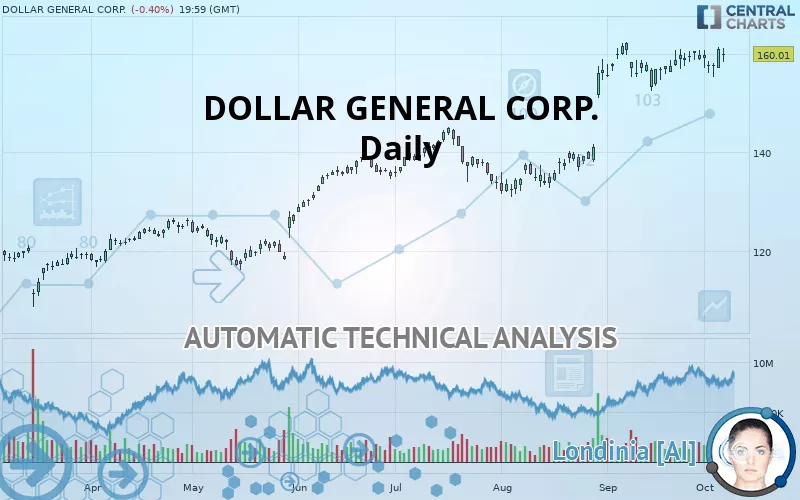
DOLLAR GENERAL CORP. - Daily - Technical analysis published on 10/08/2019 (GMT)
- 323
- 0
- 10/08/2019 - 13:19
- Who voted?
Click here for a new analysis!
- Timeframe : Daily
- - Analysis generated on 10/08/2019 - 13:17
- Status : TARGET REACHED
Summary of the analysis

Additional analysis
Quotes
DOLLAR GENERAL CORP. rating 160.01 USD. The price registered a decrease of -0.40% on the session with the lowest point at 158.33 USD and the highest point at 161.08 USD. The deviation from the price is +1.06% for the low point and -0.66% for the high point.The Central Gaps scanner detects a bearish opening. A small advantage for sellers in the very short term.
Bearish opening
Type : Bearish
Timeframe : Openning
A study of price movements over other periods shows the following variations:
Near a new HIGH record (5 years)
Type : Bullish
Timeframe : Weekly
Near a new HIGH record (1 year)
Type : Bullish
Timeframe : Weekly
Near a new HIGH record (1st january)
Type : Bullish
Timeframe : Weekly
Technical
Technical analysis of DOLLAR GENERAL CORP. in Daily shows a strongly overall bullish trend. 89.29% of the signals given by moving averages are bullish. The slightly bullish signals given by the short-term moving averages indicate this trend is showing signs of running out of steam. The Central Indicators market scanner is currently detecting a bullish signal that could impact this trend:
Bullish price crossover with Moving Average 20
Type : Bullish
Timeframe : Daily
In fact, according to the parameters integrated into the Central Analyzer system, 11 technical indicators out of 18 analysed are currently bullish. But beware of excesses. The Central Indicators scanner currently detects this:
Williams %R indicator is overbought : over -20
Type : Neutral
Timeframe : Daily
Price is back over the pivot point
Type : Bullish
Timeframe : Daily
An analysis of the price chart with the Central Patterns scanner (detector of chart patterns and resistances and supports) shows a result that can have an impact on the price change:
Near horizontal resistance
Type : Bearish
Timeframe : Daily
The presence of a bullish Japanese candlestick pattern detected by Central Candlesticks that could cause a very short term rebound was also detected:
Bullish engulfing lines
Type : Bullish
Timeframe : Daily
| S3 | S2 | S1 | Price | R1 | |
|---|---|---|---|---|---|
| ProTrendLines | 132.15 | 144.97 | 153.17 | 160.01 | 161.54 |
| Change (%) | -17.41% | -9.40% | -4.27% | - | +0.96% |
| Change | -27.86 | -15.04 | -6.84 | - | +1.53 |
| Level | Major | Minor | Intermediate | - | Major |
Attention could also be paid to pivot points to set price objectives:
| Pivot points | S3 | S2 | S1 | PP | R1 | R2 | R3 |
|---|---|---|---|---|---|---|---|
| Standard | 153.56 | 155.13 | 157.89 | 159.46 | 162.22 | 163.79 | 166.55 |
| Camarilla | 159.46 | 159.86 | 160.25 | 160.65 | 161.05 | 161.44 | 161.84 |
| Woodie | 154.15 | 155.43 | 158.48 | 159.76 | 162.82 | 164.09 | 167.15 |
| Fibonacci | 155.13 | 156.78 | 157.80 | 159.46 | 161.11 | 162.14 | 163.79 |
| Pivot points | S3 | S2 | S1 | PP | R1 | R2 | R3 |
|---|---|---|---|---|---|---|---|
| Standard | 150.70 | 152.84 | 156.74 | 158.89 | 162.79 | 164.94 | 168.84 |
| Camarilla | 158.99 | 159.54 | 160.10 | 160.65 | 161.20 | 161.76 | 162.31 |
| Woodie | 151.58 | 153.28 | 157.63 | 159.33 | 163.67 | 165.38 | 169.72 |
| Fibonacci | 152.84 | 155.15 | 156.58 | 158.89 | 161.20 | 162.63 | 164.94 |
| Pivot points | S3 | S2 | S1 | PP | R1 | R2 | R3 |
|---|---|---|---|---|---|---|---|
| Standard | 143.16 | 147.61 | 153.12 | 157.57 | 163.08 | 167.53 | 173.04 |
| Camarilla | 155.89 | 156.80 | 157.71 | 158.62 | 159.54 | 160.45 | 161.36 |
| Woodie | 143.68 | 147.87 | 153.64 | 157.83 | 163.60 | 167.79 | 173.56 |
| Fibonacci | 147.61 | 151.41 | 153.76 | 157.57 | 161.37 | 163.72 | 167.53 |
Numerical data
The following is the status of technical indicators and moving averages registered at the time this technical analysis was created:
| RSI (14): | 63.37 | |
| MACD (12,26,9): | 2.8800 | |
| Directional Movement: | 8.31 | |
| AROON (14): | 100.00 | |
| DEMA (21): | 161.11 | |
| Parabolic SAR (0,02-0,02-0,2): | 154.93 | |
| Elder Ray (13): | 1.51 | |
| Super Trend (3,10): | 150.46 | |
| Zig ZAG (10): | 160.01 | |
| VORTEX (21): | 0.9500 | |
| Stochastique (14,3,5): | 79.55 | |
| TEMA (21): | 160.39 | |
| Williams %R (14): | -16.01 | |
| Chande Momentum Oscillator (20): | 3.51 | |
| Repulse (5,40,3): | 2.4800 | |
| ROCnROLL: | 1 | |
| TRIX (15,9): | 0.3400 | |
| Courbe Coppock: | 3.27 |
| MA7: | 158.87 | |
| MA20: | 157.60 | |
| MA50: | 147.59 | |
| MA100: | 140.55 | |
| MAexp7: | 158.96 | |
| MAexp20: | 156.84 | |
| MAexp50: | 150.31 | |
| MAexp100: | 142.41 | |
| Price / MA7: | +0.72% | |
| Price / MA20: | +1.53% | |
| Price / MA50: | +8.42% | |
| Price / MA100: | +13.85% | |
| Price / MAexp7: | +0.66% | |
| Price / MAexp20: | +2.02% | |
| Price / MAexp50: | +6.45% | |
| Price / MAexp100: | +12.36% |
About author

Online


Add a comment
Comments
0 comments on the analysis DOLLAR GENERAL CORP. - Daily