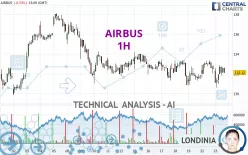
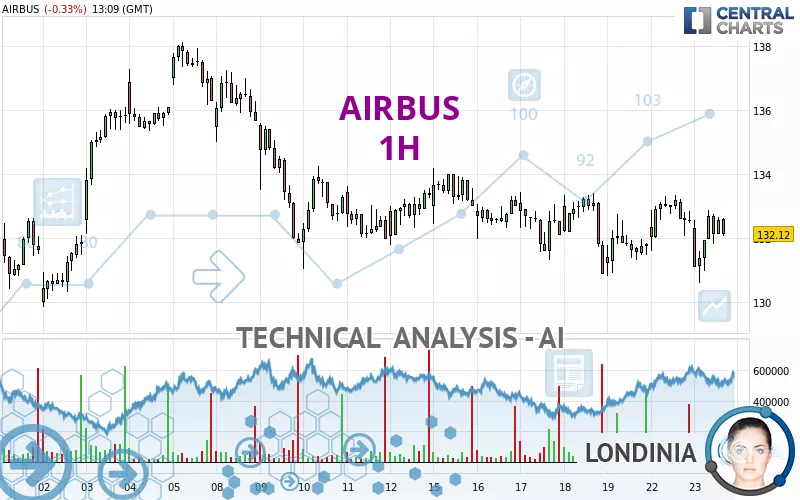
AIRBUS - 1H - Technical analysis published on 07/23/2024 (GMT)
- 181
- 0
Click here for a new analysis!
- Timeframe : 1H
- - Analysis generated on
- Status : INVALID
Summary of the analysis

Additional analysis
Quotes
The AIRBUS price is 132.50 EUR. The price registered a decrease of -0.05% on the session with the lowest point at 130.58 EUR and the highest point at 132.88 EUR. The deviation from the price is +1.47% for the low point and -0.29% for the high point.A bearish opening was detected by the Central Gaps scanner. Sellers are trying to impose a bearish trend in the very short term.
Bearish opening
Type : Bearish
Timeframe : Openning
So that you have an overall view of the price change, here is a table showing the variations over several periods:
Near a new LOW record (1st january)
Type : Bearish
Timeframe : Weekly
Near a new LOW record (1 month)
Type : Bearish
Timeframe : Weekly
Technical
Technical analysis of AIRBUS in 1H shows an overall slightly bearish trend. 57.14% of the signals given by moving averages are bearish. Caution: the strong bullish signals currently being given by short-term moving averages indicate that this slightly bearish trend could quickly be reversed. The Central Indicators market scanner is currently detecting a bearish signal that could impact this trend:
Bearish price crossover with adaptative moving average 20
Type : Bearish
Timeframe : 1 hour
In fact, according to the parameters integrated into the Central Analyzer system, 10 technical indicators out of 18 analysed are currently bullish. Central Indicators, the scanner specialised in technical indicators, has identified these signals:
RSI indicator is back over 50
Type : Bullish
Timeframe : 1 hour
MACD crosses UP its Moving Average
Type : Bullish
Timeframe : 1 hour
Price is back under the pivot point
Type : Bearish
Timeframe : 1 hour
The analysis of the price chart with Central Patterns scanners does not return any result.
The Central Candlesticks scanner, specialised in Japanese candlesticks, did not identify any signals.
| S3 | S2 | S1 | Price | R1 | R2 | R3 | |
|---|---|---|---|---|---|---|---|
| ProTrendLines | 119.18 | 128.25 | 131.15 | 132.50 | 132.79 | 135.34 | 138.14 |
| Change (%) | -10.05% | -3.21% | -1.02% | - | +0.22% | +2.14% | +4.26% |
| Change | -13.32 | -4.25 | -1.35 | - | +0.29 | +2.84 | +5.64 |
| Level | Major | Major | Intermediate | - | Major | Minor | Intermediate |
Pivot points can also be used to set your price objectives. Here is the price situation in relation to pivot points:
| Pivot points | S3 | S2 | S1 | PP | R1 | R2 | R3 |
|---|---|---|---|---|---|---|---|
| Standard | 129.86 | 130.72 | 131.64 | 132.50 | 133.42 | 134.28 | 135.20 |
| Camarilla | 132.07 | 132.23 | 132.40 | 132.56 | 132.72 | 132.89 | 133.05 |
| Woodie | 129.89 | 130.74 | 131.67 | 132.52 | 133.45 | 134.30 | 135.23 |
| Fibonacci | 130.72 | 131.40 | 131.82 | 132.50 | 133.18 | 133.60 | 134.28 |
| Pivot points | S3 | S2 | S1 | PP | R1 | R2 | R3 |
|---|---|---|---|---|---|---|---|
| Standard | 126.96 | 128.88 | 130.34 | 132.26 | 133.72 | 135.64 | 137.10 |
| Camarilla | 130.87 | 131.18 | 131.49 | 131.80 | 132.11 | 132.42 | 132.73 |
| Woodie | 126.73 | 128.77 | 130.11 | 132.15 | 133.49 | 135.53 | 136.87 |
| Fibonacci | 128.88 | 130.17 | 130.97 | 132.26 | 133.55 | 134.35 | 135.64 |
| Pivot points | S3 | S2 | S1 | PP | R1 | R2 | R3 |
|---|---|---|---|---|---|---|---|
| Standard | 87.75 | 107.65 | 117.95 | 137.85 | 148.15 | 168.05 | 178.35 |
| Camarilla | 119.96 | 122.72 | 125.49 | 128.26 | 131.03 | 133.80 | 136.57 |
| Woodie | 82.96 | 105.25 | 113.16 | 135.45 | 143.36 | 165.65 | 173.56 |
| Fibonacci | 107.65 | 119.18 | 126.31 | 137.85 | 149.38 | 156.51 | 168.05 |
Numerical data
The following is the status of the technical indicators and moving averages at the time of publication of this technical analysis:
| RSI (14): | 51.83 | |
| MACD (12,26,9): | -0.0100 | |
| Directional Movement: | -3.43 | |
| AROON (14): | -35.72 | |
| DEMA (21): | 132.28 | |
| Parabolic SAR (0,02-0,02-0,2): | 132.81 | |
| Elder Ray (13): | 0.24 | |
| Super Trend (3,10): | 133.29 | |
| Zig ZAG (10): | 132.48 | |
| VORTEX (21): | 1.0400 | |
| Stochastique (14,3,5): | 65.95 | |
| TEMA (21): | 132.36 | |
| Williams %R (14): | -30.22 | |
| Chande Momentum Oscillator (20): | -0.52 | |
| Repulse (5,40,3): | 0.2200 | |
| ROCnROLL: | -1 | |
| TRIX (15,9): | 0.0000 | |
| Courbe Coppock: | 0.07 |
| MA7: | 132.26 | |
| MA20: | 132.68 | |
| MA50: | 144.97 | |
| MA100: | 152.57 | |
| MAexp7: | 132.33 | |
| MAexp20: | 132.31 | |
| MAexp50: | 132.47 | |
| MAexp100: | 133.19 | |
| Price / MA7: | +0.18% | |
| Price / MA20: | -0.14% | |
| Price / MA50: | -8.60% | |
| Price / MA100: | -13.15% | |
| Price / MAexp7: | +0.13% | |
| Price / MAexp20: | +0.14% | |
| Price / MAexp50: | +0.02% | |
| Price / MAexp100: | -0.52% |
News
The latest news and videos published on AIRBUS at the time of the analysis were as follows:
- SKY Airline selects RTX's Pratt & Whitney GTF™ engine to power up to 39 Airbus A320neo family aircraft
- Avolon selects RTX's Pratt & Whitney GTF™ engines to power up to 160 Airbus A320neo family aircraft
- Cebu Pacific Celebrates Agreement for up to 152 A321neo Aircraft Order with Airbus, RTX's Pratt & Whitney
- SMBC Aviation Capital confirms an additional 42 Airbus A320neo family aircraft powered by RTX's Pratt & Whitney GTF™ engines
- RTX to collaborate on hybrid-electric system for Airbus PioneerLab helicopter demonstrator
About author
Online


Add a comment
Comments
0 comments on the analysis AIRBUS - 1H