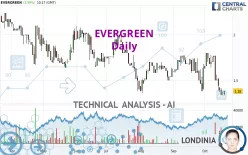
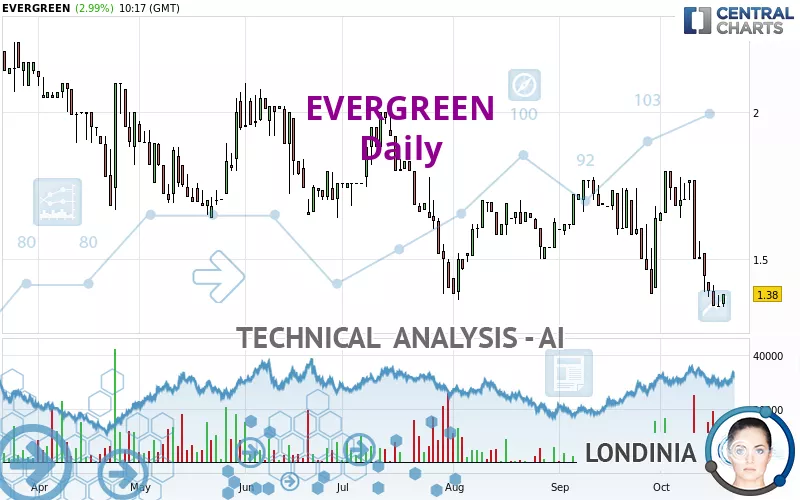
EVERGREEN - Daily - Technical analysis published on 10/18/2024 (GMT)
- 108
- 0
Click here for a new analysis!
- Timeframe : Daily
- - Analysis generated on
- Status : TARGET REACHED
Summary of the analysis

Additional analysis
Quotes
The EVERGREEN price is 1.380 EUR. The price has increased by +2.99% since the last closing with the lowest point at 1.335 EUR and the highest point at 1.380 EUR. The deviation from the price is +3.37% for the low point and 0% for the high point.The Central Gaps scanner detects a bullish opening. A small advantage for buyers in the very short term.
Bullish opening
Type : Bullish
Timeframe : Openning
A study of price movements over other periods shows the following variations:
New LOW record (1 year)
Type : Bearish
Timeframe : Weekly
New LOW record (1st january)
Type : Bearish
Timeframe : Weekly
New LOW record (1 month)
Type : Bearish
Timeframe : Weekly
Technical
Technical analysis of EVERGREEN in Daily shows a overall strongly bearish trend. 92.86% of the signals given by moving averages are bearish. This strongly bearish trend is supported by the strong bearish signals given by short-term moving averages. There is no crossing of moving average by the price or crossing of moving averages between themselves.
In fact, 13 technical indicators on 18 studied are currently positioned bearish. But beware of excesses. The Central Indicators scanner currently detects this:
CCI indicator is oversold : under -100
Type : Neutral
Timeframe : Daily
Williams %R indicator is oversold : under -80
Type : Neutral
Timeframe : Daily
Pivot points : price is over resistance 1
Type : Neutral
Timeframe : Daily
Pivot points : price is under support 1
Type : Neutral
Timeframe : Weekly
The Central Patterns scanner, which studies chart patterns, resistances and supports, has identified this signal:
Near horizontal resistance
Type : Bearish
Timeframe : Daily
The Central Candlesticks scanner, specialised in Japanese candlesticks, did not identify any signals.
| S1 | R1 | Price | R2 | R3 | |
|---|---|---|---|---|---|
| ProTrendLines | 0.566 | 1.380 | 1.380 | 1.681 | 2.050 |
| Change (%) | -58.99% | 0% | - | +21.81% | +48.55% |
| Change | -0.814 | 0 | - | +0.301 | +0.670 |
| Level | Intermediate | Major | - | Intermediate | Minor |
Pivot points can also be used to set your price objectives. Here is the price situation in relation to pivot points:
| Pivot points | S3 | S2 | S1 | PP | R1 | R2 | R3 |
|---|---|---|---|---|---|---|---|
| Standard | 1.285 | 1.310 | 1.325 | 1.350 | 1.365 | 1.390 | 1.405 |
| Camarilla | 1.329 | 1.333 | 1.336 | 1.340 | 1.344 | 1.347 | 1.351 |
| Woodie | 1.280 | 1.308 | 1.320 | 1.348 | 1.360 | 1.388 | 1.400 |
| Fibonacci | 1.310 | 1.325 | 1.335 | 1.350 | 1.365 | 1.375 | 1.390 |
| Pivot points | S3 | S2 | S1 | PP | R1 | R2 | R3 |
|---|---|---|---|---|---|---|---|
| Standard | 1.127 | 1.313 | 1.407 | 1.593 | 1.687 | 1.873 | 1.967 |
| Camarilla | 1.423 | 1.449 | 1.474 | 1.500 | 1.526 | 1.551 | 1.577 |
| Woodie | 1.080 | 1.290 | 1.360 | 1.570 | 1.640 | 1.850 | 1.920 |
| Fibonacci | 1.313 | 1.420 | 1.486 | 1.593 | 1.700 | 1.766 | 1.873 |
| Pivot points | S3 | S2 | S1 | PP | R1 | R2 | R3 |
|---|---|---|---|---|---|---|---|
| Standard | 1.020 | 1.200 | 1.420 | 1.600 | 1.820 | 2.000 | 2.220 |
| Camarilla | 1.530 | 1.567 | 1.603 | 1.640 | 1.677 | 1.713 | 1.750 |
| Woodie | 1.040 | 1.210 | 1.440 | 1.610 | 1.840 | 2.010 | 2.240 |
| Fibonacci | 1.200 | 1.353 | 1.447 | 1.600 | 1.753 | 1.847 | 2.000 |
Numerical data
The following are the details of the technical indicators and moving averages that were collected to generate this technical analysis:
| RSI (14): | 39.06 | |
| MACD (12,26,9): | -0.0690 | |
| Directional Movement: | -15.866 | |
| AROON (14): | -78.571 | |
| DEMA (21): | 1.457 | |
| Parabolic SAR (0,02-0,02-0,2): | 1.716 | |
| Elder Ray (13): | -0.135 | |
| Super Trend (3,10): | 1.645 | |
| Zig ZAG (10): | 1.380 | |
| VORTEX (21): | 0.8620 | |
| Stochastique (14,3,5): | 3.58 | |
| TEMA (21): | 1.402 | |
| Williams %R (14): | -90.32 | |
| Chande Momentum Oscillator (20): | -0.420 | |
| Repulse (5,40,3): | -3.3850 | |
| ROCnROLL: | 2 | |
| TRIX (15,9): | -0.2870 | |
| Courbe Coppock: | 18.38 |
| MA7: | 1.413 | |
| MA20: | 1.555 | |
| MA50: | 1.613 | |
| MA100: | 1.691 | |
| MAexp7: | 1.428 | |
| MAexp20: | 1.532 | |
| MAexp50: | 1.603 | |
| MAexp100: | 1.696 | |
| Price / MA7: | -2.34% | |
| Price / MA20: | -11.25% | |
| Price / MA50: | -14.45% | |
| Price / MA100: | -18.39% | |
| Price / MAexp7: | -3.36% | |
| Price / MAexp20: | -9.92% | |
| Price / MAexp50: | -13.91% | |
| Price / MAexp100: | -18.63% |
News
Don't forget to follow the news on EVERGREEN. At the time of publication of this analysis, the latest news was as follows:
- 2024 half-year results
- 2023 annual results - Strategy implemented with a major focus on infrastructure investees
- 2023 half-year results
- 2022 annual results
- Half-year results as of 30 June 2022
About author
Online


Add a comment
Comments
0 comments on the analysis EVERGREEN - Daily