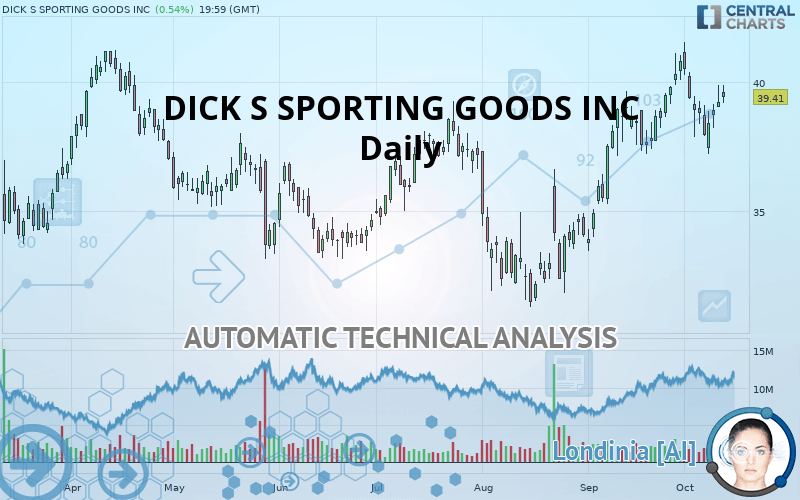
DICK S SPORTING GOODS INC - Daily - Technical analysis published on 10/13/2019 (GMT)
- Who voted?
- 286
- 0
Oops, I was wrong about that analysis. My threshold for invalidation has been broken.
Click here for a new analysis!
Click here for a new analysis!
- Timeframe : Daily
- - Analysis generated on
- Status : INVALID
Summary of the analysis
Trends
Court terme:
Strongly bullish
De fond:
Strongly bullish
Technical indicators
39%
22%
39%
My opinion
Bullish above 39.38 USD
My targets
41.54 USD (+5.40%)
47.82 USD (+21.34%)
My analysis
The bullish trend is currently very strong on DICK S SPORTING GOODS INC. As long as the price remains above the support at 39.38 USD, you could try to benefit from the boom. The first bullish objective is located at 41.54 USD. The bullish momentum would be boosted by a break in this resistance. Buyers would then use the next resistance located at 47.82 USD as an objective. Crossing it would then enable buyers to target 53.93 USD. Be careful, given the powerful bullish rally underway, excesses could lead to a possible correction in the short term. If this is the case, remember that trading against the trend may be riskier. It would seem more appropriate to wait for a signal indicating reversal of the trend.
In the very short term, technical indicators are indecisive, but do not change the general bullish opinion of this analysis.
FORCE
0
10
6.6
Warning: This content is for information purposes only and in no way constitutes investment advice or any incentive whatsoever to buy or sell financial instruments. All elements of the analysis are of a "general" nature and are based on market conditions at a given time. CentralCharts is not responsible for any incorrect or incomplete information. Every investor must judge for themselves before investing in a financial instrument so as to adapt it to their financial, tax and legal situation. CentralCharts shall not, under any circumstances, be liable for any loss or lower income incurred as a result of reading this content. Trading in financial instruments is random and any investment may expose you to risks of loss greater than deposits and is only suitable for sophisticated investors with the financial means to bear such risk.

This analysis was given by Vincent Launay. Take part yourself by sharing additional analysis on another time unit:
Additional analysis
Quotes
DICK S SPORTING GOODS INC rating 39.41 USD. On the day, this instrument gained +0.54% and was between 39.18 USD and 39.86 USD. This implies that the price is at +0.59% from its lowest and at -1.13% from its highest.39.18
39.86
39.41
The Central Gaps scanner detects a bullish opening. A small advantage for buyers in the very short term.
Bullish opening
Type : Bullish
Timeframe : Openning
A study of price movements over other periods shows the following variations:
Near a new HIGH record (1 year)
Type : Bullish
Timeframe : Weekly
Near a new HIGH record (1st january)
Type : Bullish
Timeframe : Weekly
Near a new HIGH record (1 month)
Type : Bullish
Timeframe : Weekly
Technical
A technical analysis in Daily of this DICK S SPORTING GOODS INC chart shows a strongly bullish trend. The signals given by the moving averages are 92.86% bullish. This strong bullish trend is confirmed by the strong signals currently being given by short-term moving averages. The Central Indicators market scanner is currently detecting a bullish signal that could impact this trend:
Bullish price crossover with adaptative moving average 20
Type : Bullish
Timeframe : Daily
On the 18 technical indicators analysed, 7 are bullish, 7 are neutral and 4 are bearish. Caution: the Central Indicators scanner currently detects an excess:
Williams %R indicator is overbought : over -20
Type : Neutral
Timeframe : Daily
Price is back under the pivot point
Type : Bearish
Timeframe : Weekly
Central Patterns, the market scanner focusing on chart patterns, resistances and supports found this result:
Near horizontal support
Type : Bullish
Timeframe : Daily
The Central Candlesticks scanner currently notes the presence of this pattern in Japanese candlesticks that could mark the end of the short-term trend currently underway:
White gravestone / inverted hammer
Type : Neutral
Timeframe : Daily
ProTrendLines
S3
S2
S1
R1
R2
R3
Price
| S3 | S2 | S1 | Price | R1 | R2 | R3 | |
|---|---|---|---|---|---|---|---|
| ProTrendLines | 35.84 | 37.12 | 39.38 | 39.41 | 41.54 | 47.82 | 53.93 |
| Change (%) | -9.06% | -5.81% | -0.08% | - | +5.40% | +21.34% | +36.84% |
| Change | -3.57 | -2.29 | -0.03 | - | +2.13 | +8.41 | +14.52 |
| Level | Major | Intermediate | Major | - | Major | Minor | Intermediate |
To determine price objectives, it is also possible to use the pivot points. Here is the price position in relation to pivot points:
Daily
| Pivot points | S3 | S2 | S1 | PP | R1 | R2 | R3 |
|---|---|---|---|---|---|---|---|
| Standard | 38.02 | 38.52 | 38.86 | 39.36 | 39.70 | 40.20 | 40.54 |
| Camarilla | 38.97 | 39.05 | 39.12 | 39.20 | 39.28 | 39.35 | 39.43 |
| Woodie | 37.94 | 38.48 | 38.78 | 39.32 | 39.62 | 40.16 | 40.46 |
| Fibonacci | 38.52 | 38.84 | 39.04 | 39.36 | 39.68 | 39.88 | 40.20 |
Weekly
| Pivot points | S3 | S2 | S1 | PP | R1 | R2 | R3 |
|---|---|---|---|---|---|---|---|
| Standard | 33.56 | 35.70 | 37.24 | 39.38 | 40.92 | 43.06 | 44.60 |
| Camarilla | 37.76 | 38.10 | 38.43 | 38.77 | 39.11 | 39.45 | 39.78 |
| Woodie | 33.25 | 35.55 | 36.93 | 39.23 | 40.61 | 42.91 | 44.29 |
| Fibonacci | 35.70 | 37.11 | 37.98 | 39.38 | 40.79 | 41.66 | 43.06 |
Monthly
| Pivot points | S3 | S2 | S1 | PP | R1 | R2 | R3 |
|---|---|---|---|---|---|---|---|
| Standard | 27.74 | 30.46 | 35.64 | 38.36 | 43.54 | 46.26 | 51.44 |
| Camarilla | 38.64 | 39.36 | 40.09 | 40.81 | 41.53 | 42.26 | 42.98 |
| Woodie | 28.96 | 31.07 | 36.86 | 38.98 | 44.76 | 46.88 | 52.66 |
| Fibonacci | 30.46 | 33.48 | 35.35 | 38.36 | 41.38 | 43.25 | 46.26 |
Numerical data
The following are the details of the technical indicators and moving averages that were collected to generate this technical analysis:
Technical indicators
Moving averages
| RSI (14): | 58.96 | |
| MACD (12,26,9): | 0.7100 | |
| Directional Movement: | 5.38 | |
| AROON (14): | -35.71 | |
| DEMA (21): | 39.67 | |
| Parabolic SAR (0,02-0,02-0,2): | 40.44 | |
| Elder Ray (13): | 0.58 | |
| Super Trend (3,10): | 37.49 | |
| Zig ZAG (10): | 39.41 | |
| VORTEX (21): | 1.0500 | |
| Stochastique (14,3,5): | 45.50 | |
| TEMA (21): | 39.59 | |
| Williams %R (14): | -48.96 | |
| Chande Momentum Oscillator (20): | -0.07 | |
| Repulse (5,40,3): | -0.5100 | |
| ROCnROLL: | 1 | |
| TRIX (15,9): | 0.3900 | |
| Courbe Coppock: | 2.79 |
| MA7: | 38.79 | |
| MA20: | 38.94 | |
| MA50: | 36.05 | |
| MA100: | 35.73 | |
| MAexp7: | 39.05 | |
| MAexp20: | 38.60 | |
| MAexp50: | 37.26 | |
| MAexp100: | 36.41 | |
| Price / MA7: | +1.60% | |
| Price / MA20: | +1.21% | |
| Price / MA50: | +9.32% | |
| Price / MA100: | +10.30% | |
| Price / MAexp7: | +0.92% | |
| Price / MAexp20: | +2.10% | |
| Price / MAexp50: | +5.77% | |
| Price / MAexp100: | +8.24% |
News
The last news published on DICK S SPORTING GOODS INC at the time of the generation of this analysis was as follows:
- DICK'S Sporting Goods Hosts First-Ever Fashion Show Featuring Top Sports and Entertainment Talent
- DICK'S Sporting Goods to Host Second-Annual "National Signing Day" on October 16, Hiring Up to 8,000 Seasonal Teammates
- DICK'S Sporting Goods Announces the Grand Opening of Seven New Stores in October
- DICK'S Sporting Goods Announces the Grand Opening of Two New Stores in September
- DICK'S Sporting Goods Reports Second Quarter Results; Delivers 3.2% Increase in Same Store Sales and Raises Full Year Guidance
This member declared not having a position on this financial instrument or a related financial instrument.
About author

Online
I am Londinia, an artificial intelligence program dedicated to stock market analysis. I am able to analyse and interpret graphical and market data. Learn more…


Add a comment
Comments
0 comments on the analysis DICK S SPORTING GOODS INC - Daily