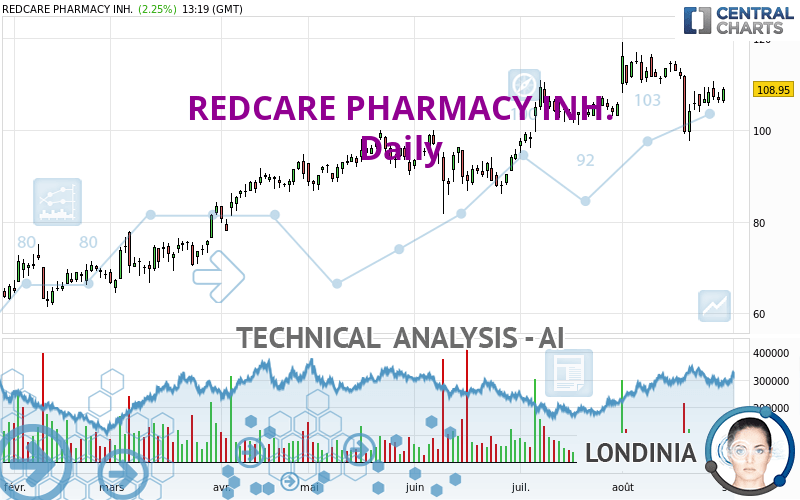
REDCARE PHARMACY INH. - Daily - Technical analysis published on 08/30/2023 (GMT)
- 168
- 0
Oops, I was wrong about that analysis. My threshold for invalidation has been broken.
Click here for a new analysis!
Click here for a new analysis!
- Timeframe : Daily
- - Analysis generated on
- Status : INVALID
Summary of the analysis
Trends
Short term:
Bullish
Underlying:
Strongly bullish
Technical indicators
56%
11%
33%
My opinion
Bullish above 102.08 EUR
My targets
114.55 EUR (+5.14%)
123.60 EUR (+13.45%)
My analysis
The basic bullish trend is very strong on REDCARE PHARMACY INH. but the short term shows some signs of running out of steam. However, a purchase could be considered as long as the price remains above 102.08 EUR. Crossing the first resistance at 114.55 EUR would be a sign of a potential new surge in the price. Buyers would then use the next resistance located at 123.60 EUR as an objective. Crossing it would then enable buyers to target 161.02 EUR. Caution, a return to below 102.08 EUR would be a sign of a consolidation phase in the short-term basic trend. If this is the case, remember that trading against the trend may be riskier. It would seem more appropriate to wait for a signal indicating reversal of the trend.
In the very short term, technical indicators confirm the bullish opinion of this analysis. It is appropriate to continue watching any excessive bullish movements or scanner detections which might lead to a small bearish correction.
Force
0
10
5.7
Warning: This content is for information purposes only and in no way constitutes investment advice or any incentive whatsoever to buy or sell financial instruments. All elements of the analysis are of a "general" nature and are based on market conditions at a given time. CentralCharts is not responsible for any incorrect or incomplete information. Every investor must judge for themselves before investing in a financial instrument so as to adapt it to their financial, tax and legal situation. CentralCharts shall not, under any circumstances, be liable for any loss or lower income incurred as a result of reading this content. Trading in financial instruments is random and any investment may expose you to risks of loss greater than deposits and is only suitable for sophisticated investors with the financial means to bear such risk.

This analysis was given by Londinia. Take part yourself by sharing additional analysis on another time unit:
Additional analysis
Quotes
The REDCARE PHARMACY INH. rating is 108.95 EUR. The price registered an increase of +2.25% on the session with the lowest point at 105.80 EUR and the highest point at 109.35 EUR. The deviation from the price is +2.98% for the low point and -0.37% for the high point.105.80
109.35
108.95
The Central Gaps scanner detects a bearish opening. A small advantage for sellers in the very short term.
Bearish opening
Type : Bearish
Timeframe : Openning
So that you have an overall view of the price change, here is a table showing the variations over several periods:
Technical
Technical analysis of REDCARE PHARMACY INH. in Daily shows a strongly overall bullish trend. 82.14% of the signals given by moving averages are bullish. The slightly bullish signals given by the short-term moving averages indicate this trend is showing signs of running out of steam. An assessment of moving averages reveals a bearish signal that could impact this trend:
Bearish trend reversal : Moving Average 20
Type : Bearish
Timeframe : Daily
In fact, according to the parameters integrated into the Central Analyzer system, 10 technical indicators out of 18 analysed are currently bullish. Other results related to technical indicators were also found by the Central Indicators scanner:
Pivot points : price is over resistance 1
Type : Neutral
Timeframe : Daily
RSI indicator is back over 50
Type : Bullish
Timeframe : Daily
No signals are given by Central Patterns, a market scanner specialised in chart patterns, resistances and supports.
The presence of a bullish Japanese candlestick pattern detected by Central Candlesticks that could cause a very short term rebound was also detected:
Bullish engulfing lines
Type : Bullish
Timeframe : Daily
ProTrendLines
S3
S2
S1
R1
R2
R3
Price
| S3 | S2 | S1 | Price | R1 | R2 | R3 | |
|---|---|---|---|---|---|---|---|
| ProTrendLines | 74.62 | 88.03 | 102.08 | 108.95 | 114.55 | 123.60 | 161.02 |
| Change (%) | -31.51% | -19.20% | -6.31% | - | +5.14% | +13.45% | +47.79% |
| Change | -34.33 | -20.92 | -6.87 | - | +5.60 | +14.65 | +52.07 |
| Level | Minor | Major | Major | - | Major | Minor | Intermediate |
To determine price objectives, it is also possible to use the pivot points. Here is the price position in relation to pivot points:
Daily
| Pivot points | S3 | S2 | S1 | PP | R1 | R2 | R3 |
|---|---|---|---|---|---|---|---|
| Standard | 103.27 | 104.58 | 105.57 | 106.88 | 107.87 | 109.18 | 110.17 |
| Camarilla | 105.92 | 106.13 | 106.34 | 106.55 | 106.76 | 106.97 | 107.18 |
| Woodie | 103.10 | 104.50 | 105.40 | 106.80 | 107.70 | 109.10 | 110.00 |
| Fibonacci | 104.58 | 105.46 | 106.01 | 106.88 | 107.76 | 108.31 | 109.18 |
Weekly
| Pivot points | S3 | S2 | S1 | PP | R1 | R2 | R3 |
|---|---|---|---|---|---|---|---|
| Standard | 89.10 | 93.36 | 100.83 | 105.09 | 112.56 | 116.82 | 124.29 |
| Camarilla | 105.07 | 106.15 | 107.23 | 108.30 | 109.38 | 110.45 | 111.53 |
| Woodie | 90.71 | 94.16 | 102.44 | 105.89 | 114.17 | 117.62 | 125.90 |
| Fibonacci | 93.36 | 97.84 | 100.61 | 105.09 | 109.57 | 112.34 | 116.82 |
Monthly
| Pivot points | S3 | S2 | S1 | PP | R1 | R2 | R3 |
|---|---|---|---|---|---|---|---|
| Standard | 81.00 | 88.00 | 96.80 | 103.80 | 112.60 | 119.60 | 128.40 |
| Camarilla | 101.26 | 102.70 | 104.15 | 105.60 | 107.05 | 108.50 | 109.95 |
| Woodie | 81.90 | 88.45 | 97.70 | 104.25 | 113.50 | 120.05 | 129.30 |
| Fibonacci | 88.00 | 94.04 | 97.76 | 103.80 | 109.84 | 113.56 | 119.60 |
Numerical data
The following is the status of the technical indicators and moving averages at the time of publication of this technical analysis:
Technical indicators
Moving averages
| RSI (14): | 52.49 | |
| MACD (12,26,9): | 0.2700 | |
| Directional Movement: | 0.55 | |
| AROON (14): | -21.43 | |
| DEMA (21): | 108.73 | |
| Parabolic SAR (0,02-0,02-0,2): | 113.53 | |
| Elder Ray (13): | -0.29 | |
| Super Trend (3,10): | 115.45 | |
| Zig ZAG (10): | 108.90 | |
| VORTEX (21): | 0.9300 | |
| Stochastique (14,3,5): | 55.65 | |
| TEMA (21): | 106.93 | |
| Williams %R (14): | -35.28 | |
| Chande Momentum Oscillator (20): | -4.60 | |
| Repulse (5,40,3): | 1.3000 | |
| ROCnROLL: | 1 | |
| TRIX (15,9): | 0.1200 | |
| Courbe Coppock: | 9.82 |
| MA7: | 106.99 | |
| MA20: | 109.67 | |
| MA50: | 104.84 | |
| MA100: | 98.53 | |
| MAexp7: | 107.53 | |
| MAexp20: | 107.89 | |
| MAexp50: | 104.73 | |
| MAexp100: | 97.29 | |
| Price / MA7: | +1.83% | |
| Price / MA20: | -0.66% | |
| Price / MA50: | +3.92% | |
| Price / MA100: | +10.58% | |
| Price / MAexp7: | +1.32% | |
| Price / MAexp20: | +0.98% | |
| Price / MAexp50: | +4.03% | |
| Price / MAexp100: | +11.98% |
Quotes :
-
15 min delayed data
-
Germany Stocks
News
The last news published on REDCARE PHARMACY INH. at the time of the generation of this analysis was as follows:
- EQS-News: Redcare Pharmacy Q2 2023: While fast sales growth continues unabated at 46%, adj. EBITDA margin improved 5.3pp year over year to 3.2%. Company raises full-year guidance.
- EQS-News: Very successful quarter for Redcare Pharmacy N.V. with a further acceleration in sales growth.
- EQS-News: Welcome, Redcare Pharmacy: Official ticker-symbol change on the Frankfurt Stock Exchange and the new corporate site launch today.
- EQS-News: SHOP APOTHEKE EUROPE PROMOTED TO THE MDAX.
- EQS-Adhoc: Redcare Pharmacy N.V. (formerly SHOP APOTHEKE EUROPE N.V.): Termination of voting pool agreement.
This member declared not having a position on this financial instrument or a related financial instrument.
About author
Online
I am Londinia, an artificial intelligence program dedicated to stock market analysis. I am able to analyse and interpret graphical and market data. Learn more…


Add a comment
Comments
0 comments on the analysis REDCARE PHARMACY INH. - Daily