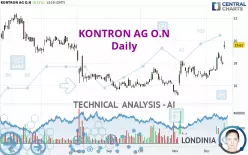
KONTRON AG O.N - Daily - Technical analysis published on 12/18/2024 (GMT)
- 127
- 0
Click here for a new analysis!
- Timeframe : Daily
- - Analysis generated on
- Status : INVALID

Summary of the analysis

Additional analysis
Quotes
The KONTRON AG O.N price is 19.61 EUR. The price registered an increase of +9.31% on the session and was between 19.26 EUR and 19.96 EUR. This implies that the price is at +1.82% from its lowest and at -1.75% from its highest.A bullish gap was detected at the opening by the Central Gaps scanner. There are a lot of buyers and they have the upper hand in the very short term.
Opening Gap UP
Type : Bullish
Timeframe : Openning
Here is a more detailed summary of the historical variations registered by KONTRON AG O.N:
New HIGH record (1 month)
Type : Bullish
Timeframe : Weekly
Technical
Technical analysis of KONTRON AG O.N in Daily shows a strongly overall bullish trend. The signals given by the moving averages are 89.29% bullish. This strong bullish trend is confirmed by the strong signals currently being given by short-term moving averages. There is no crossing of moving average by the price or crossing of moving averages between themselves.
The probability of a further increase is high given the direction of the technical indicators.
But beware of excesses. The Central Indicators scanner currently detects this:
RSI indicator is overbought : over 70
Type : Neutral
Timeframe : Daily
CCI indicator is overbought : over 100
Type : Neutral
Timeframe : Daily
Williams %R indicator is overbought : over -20
Type : Neutral
Timeframe : Daily
Pivot points : price is over resistance 1
Type : Neutral
Timeframe : Weekly
Pivot points : price is over resistance 3
Type : Neutral
Timeframe : Daily
An analysis of the price chart with the Central Patterns scanner (detector of chart patterns and resistances and supports) shows a result that can have an impact on the price change:
Resistance of channel is broken
Type : Bullish
Timeframe : Daily
Central Candlesticks, the scanner specialised in Japanese candlesticks, detects a bullish signal that could support the hypothesis of a small rebound in the very short term:
White morning star
Type : Bullish
Timeframe : Daily
| S3 | S2 | S1 | Price | R1 | R2 | R3 | |
|---|---|---|---|---|---|---|---|
| ProTrendLines | 16.77 | 17.49 | 18.88 | 19.61 | 20.77 | 21.62 | 22.26 |
| Change (%) | -14.48% | -10.81% | -3.72% | - | +5.92% | +10.25% | +13.51% |
| Change | -2.84 | -2.12 | -0.73 | - | +1.16 | +2.01 | +2.65 |
| Level | Intermediate | Major | Major | - | Intermediate | Minor | Major |
Pivot points can also be used to set your price objectives. Here is the price situation in relation to pivot points:
| Pivot points | S3 | S2 | S1 | PP | R1 | R2 | R3 |
|---|---|---|---|---|---|---|---|
| Standard | 17.45 | 17.65 | 17.79 | 17.99 | 18.13 | 18.33 | 18.47 |
| Camarilla | 17.85 | 17.88 | 17.91 | 17.94 | 17.97 | 18.00 | 18.03 |
| Woodie | 17.43 | 17.64 | 17.77 | 17.98 | 18.11 | 18.32 | 18.45 |
| Fibonacci | 17.65 | 17.78 | 17.86 | 17.99 | 18.12 | 18.20 | 18.33 |
| Pivot points | S3 | S2 | S1 | PP | R1 | R2 | R3 |
|---|---|---|---|---|---|---|---|
| Standard | 15.84 | 16.57 | 17.56 | 18.29 | 19.28 | 20.01 | 21.00 |
| Camarilla | 18.09 | 18.25 | 18.40 | 18.56 | 18.72 | 18.88 | 19.03 |
| Woodie | 15.98 | 16.64 | 17.70 | 18.36 | 19.42 | 20.08 | 21.14 |
| Fibonacci | 16.57 | 17.22 | 17.63 | 18.29 | 18.94 | 19.35 | 20.01 |
| Pivot points | S3 | S2 | S1 | PP | R1 | R2 | R3 |
|---|---|---|---|---|---|---|---|
| Standard | 12.40 | 13.77 | 15.46 | 16.83 | 18.52 | 19.89 | 21.58 |
| Camarilla | 16.30 | 16.58 | 16.86 | 17.14 | 17.42 | 17.70 | 17.98 |
| Woodie | 12.55 | 13.85 | 15.61 | 16.91 | 18.67 | 19.97 | 21.73 |
| Fibonacci | 13.77 | 14.94 | 15.66 | 16.83 | 18.00 | 18.72 | 19.89 |
Numerical data
The following is the status of technical indicators and moving averages registered at the time this technical analysis was created:
| RSI (14): | 72.25 | |
| MACD (12,26,9): | 0.4800 | |
| Directional Movement: | 32.29 | |
| AROON (14): | 85.71 | |
| DEMA (21): | 18.35 | |
| Parabolic SAR (0,02-0,02-0,2): | 16.99 | |
| Elder Ray (13): | 1.56 | |
| Super Trend (3,10): | 17.73 | |
| Zig ZAG (10): | 19.69 | |
| VORTEX (21): | 1.0400 | |
| Stochastique (14,3,5): | 71.02 | |
| TEMA (21): | 18.64 | |
| Williams %R (14): | -8.01 | |
| Chande Momentum Oscillator (20): | 2.88 | |
| Repulse (5,40,3): | -0.1600 | |
| ROCnROLL: | 1 | |
| TRIX (15,9): | 0.2600 | |
| Courbe Coppock: | 16.55 |
| MA7: | 18.38 | |
| MA20: | 17.55 | |
| MA50: | 17.05 | |
| MA100: | 16.77 | |
| MAexp7: | 18.43 | |
| MAexp20: | 17.79 | |
| MAexp50: | 17.30 | |
| MAexp100: | 17.44 | |
| Price / MA7: | +6.69% | |
| Price / MA20: | +11.74% | |
| Price / MA50: | +15.01% | |
| Price / MA100: | +16.94% | |
| Price / MAexp7: | +6.40% | |
| Price / MAexp20: | +10.23% | |
| Price / MAexp50: | +13.35% | |
| Price / MAexp100: | +12.44% |
News
Don't forget to follow the news on KONTRON AG O.N. At the time of publication of this analysis, the latest news was as follows:
- EQS-News: Kontron secures another major defense and security order expected to be worth around EUR 165 million
- EQS-News: Kontron continues successful collaboration with a leading U.S. Aerospace & Defense firm
- EQS-News: Kontron secures a EUR 65 Mio design win in rail infrastructure
- EQS-News: Kontron: Significant increase in margins in first nine months of 2024 – continuing on growth path
- EQS-News: Kontron AG Highlights Collaboration with Qualcomm to Transform Edge Computing and AI
About author
Online


Add a comment
Comments
0 comments on the analysis KONTRON AG O.N - Daily