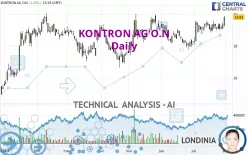
KONTRON AG O.N - Daily - Technical analysis published on 07/31/2023 (GMT)
- 139
- 0
Click here for a new analysis!
- Timeframe : Daily
- - Analysis generated on
- Status : INVALID

Summary of the analysis

Additional analysis
Quotes
The KONTRON AG O.N rating is 19.83 EUR. The price registered an increase of +2.43% on the session with the lowest point at 19.22 EUR and the highest point at 19.90 EUR. The deviation from the price is +3.17% for the low point and -0.35% for the high point.A bearish opening was detected by the Central Gaps scanner. Sellers are trying to impose a bearish trend in the very short term.
Bearish opening
Type : Bearish
Timeframe : Openning
Here is a more detailed summary of the historical variations registered by KONTRON AG O.N:
Near a new HIGH record (1 year)
Type : Bullish
Timeframe : Weekly
Near a new HIGH record (1st january)
Type : Bullish
Timeframe : Weekly
Near a new HIGH record (1 month)
Type : Bullish
Timeframe : Weekly
Technical
A technical analysis in Daily of this KONTRON AG O.N chart shows a strongly bullish trend. 92.86% of the signals given by moving averages are bullish. The overall trend is supported by the strong bullish signals from short-term moving averages. The Central Indicators market scanner currently does not detect any result that concerns moving averages.
In fact, 14 technical indicators on 18 studied are currently positioned bullish. Caution: the Central Indicators scanner currently detects an excess:
CCI indicator is overbought : over 100
Type : Neutral
Timeframe : Daily
Williams %R indicator is overbought : over -20
Type : Neutral
Timeframe : Daily
Pivot points : price is over resistance 2
Type : Neutral
Timeframe : Daily
Momentum indicator is back over 0
Type : Bullish
Timeframe : Daily
Central Patterns, the market scanner focusing on chart patterns, resistances and supports found these results:
Horizontal resistance is broken
Type : Bullish
Timeframe : Daily
Resistance of channel is broken
Type : Bullish
Timeframe : Daily
Resistance of triangle is broken
Type : Bullish
Timeframe : Daily
Central Candlesticks, the scanner specialised in Japanese candlesticks, detects a bullish signal that could support the hypothesis of a small rebound in the very short term:
Three white soldiers
Type : Bullish
Timeframe : Daily
| S3 | S2 | S1 | Price | R1 | R2 | R3 | |
|---|---|---|---|---|---|---|---|
| ProTrendLines | 17.98 | 18.81 | 19.41 | 19.83 | 20.00 | 21.76 | 22.98 |
| Change (%) | -9.33% | -5.14% | -2.12% | - | +0.86% | +9.73% | +15.89% |
| Change | -1.85 | -1.02 | -0.42 | - | +0.17 | +1.93 | +3.15 |
| Level | Major | Major | Intermediate | - | Minor | Intermediate | Intermediate |
Attention could also be paid to pivot points to set price objectives:
| Pivot points | S3 | S2 | S1 | PP | R1 | R2 | R3 |
|---|---|---|---|---|---|---|---|
| Standard | 18.68 | 18.87 | 19.11 | 19.30 | 19.54 | 19.73 | 19.97 |
| Camarilla | 19.24 | 19.28 | 19.32 | 19.36 | 19.40 | 19.44 | 19.48 |
| Woodie | 18.72 | 18.88 | 19.15 | 19.31 | 19.58 | 19.74 | 20.01 |
| Fibonacci | 18.87 | 19.03 | 19.13 | 19.30 | 19.46 | 19.56 | 19.73 |
| Pivot points | S3 | S2 | S1 | PP | R1 | R2 | R3 |
|---|---|---|---|---|---|---|---|
| Standard | 18.57 | 18.77 | 19.07 | 19.27 | 19.57 | 19.77 | 20.07 |
| Camarilla | 19.22 | 19.27 | 19.31 | 19.36 | 19.41 | 19.45 | 19.50 |
| Woodie | 18.61 | 18.80 | 19.11 | 19.30 | 19.61 | 19.80 | 20.11 |
| Fibonacci | 18.77 | 18.96 | 19.08 | 19.27 | 19.46 | 19.58 | 19.77 |
| Pivot points | S3 | S2 | S1 | PP | R1 | R2 | R3 |
|---|---|---|---|---|---|---|---|
| Standard | 15.61 | 16.69 | 17.40 | 18.48 | 19.19 | 20.27 | 20.98 |
| Camarilla | 17.62 | 17.78 | 17.95 | 18.11 | 18.27 | 18.44 | 18.60 |
| Woodie | 15.43 | 16.60 | 17.22 | 18.39 | 19.01 | 20.18 | 20.80 |
| Fibonacci | 16.69 | 17.37 | 17.80 | 18.48 | 19.16 | 19.59 | 20.27 |
Numerical data
The following is the status of the technical indicators and moving averages at the time of publication of this technical analysis:
| RSI (14): | 64.87 | |
| MACD (12,26,9): | 0.2100 | |
| Directional Movement: | 15.57 | |
| AROON (14): | 64.29 | |
| DEMA (21): | 19.46 | |
| Parabolic SAR (0,02-0,02-0,2): | 18.87 | |
| Elder Ray (13): | 0.27 | |
| Super Trend (3,10): | 18.32 | |
| Zig ZAG (10): | 19.86 | |
| VORTEX (21): | 1.1100 | |
| Stochastique (14,3,5): | 71.96 | |
| TEMA (21): | 19.49 | |
| Williams %R (14): | -4.72 | |
| Chande Momentum Oscillator (20): | 0.40 | |
| Repulse (5,40,3): | 5.0300 | |
| ROCnROLL: | 1 | |
| TRIX (15,9): | 0.1500 | |
| Courbe Coppock: | 2.24 |
| MA7: | 19.32 | |
| MA20: | 19.29 | |
| MA50: | 18.88 | |
| MA100: | 18.03 | |
| MAexp7: | 19.39 | |
| MAexp20: | 19.19 | |
| MAexp50: | 18.79 | |
| MAexp100: | 18.21 | |
| Price / MA7: | +2.64% | |
| Price / MA20: | +2.80% | |
| Price / MA50: | +5.03% | |
| Price / MA100: | +9.98% | |
| Price / MAexp7: | +2.27% | |
| Price / MAexp20: | +3.34% | |
| Price / MAexp50: | +5.53% | |
| Price / MAexp100: | +8.90% |
About author
Online


Add a comment
Comments
0 comments on the analysis KONTRON AG O.N - Daily