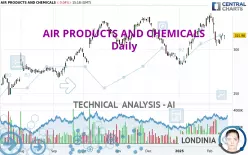
AIR PRODUCTS AND CHEMICALS - Daily - Technical analysis published on 02/18/2025 (GMT)
- 151
- 0
Oops, I was wrong about that analysis. My threshold for invalidation has been broken.
Click here for a new analysis!
Click here for a new analysis!
- Timeframe : Daily
- - Analysis generated on
- Status : INVALID

Summary of the analysis
Trends
Short term:
Neutral
Underlying:
Bullish
Technical indicators
17%
28%
56%
My opinion
Bullish above 304.22 USD
My targets
333.57 USD (+5.57%)
My analysis
Has the basic bullish trend slowed or is it lacking in power? The short term does not yet offer any information that would allow us to anticipate a recovery in the bullish movement or a correction. Sellers' generally have the upper hand, even if a small correction (not tradeable) on the support located at 304.22 USD remains possible. It is advisable to trade AIR PRODUCTS AND CHEMICALS with the greatest caution, while favouring long positions (at the time of purchase) as long as the price remains well above 304.22 USD. The next bullish objective for buyers is set at 333.57 USD. A bullish break in this resistance would boost the bullish momentum. PS: if there is a bearish break in the support located at 304.22 USD we suggest that you produce a new automated technical analysis. In fact, conditions should have changed. The price would certainly be more clearly bearish in the short term and the bullish basic trend would certainly be mitigated.
Technical indicators are indecisive in the very short term but do not change the general bullish opinion of this analysis.
Force
0
10
1.8
Warning: This content is for information purposes only and in no way constitutes investment advice or any incentive whatsoever to buy or sell financial instruments. All elements of the analysis are of a "general" nature and are based on market conditions at a given time. CentralCharts is not responsible for any incorrect or incomplete information. Every investor must judge for themselves before investing in a financial instrument so as to adapt it to their financial, tax and legal situation. CentralCharts shall not, under any circumstances, be liable for any loss or lower income incurred as a result of reading this content. Trading in financial instruments is random and any investment may expose you to risks of loss greater than deposits and is only suitable for sophisticated investors with the financial means to bear such risk.

This analysis was given by Londinia. Take part yourself by sharing additional analysis on another time unit:
Additional analysis
Quotes
AIR PRODUCTS AND CHEMICALS rating 315.98 USD. The price registered a decrease of -0.04% on the session with the lowest point at 311.68 USD and the highest point at 316.36 USD. The deviation from the price is +1.38% for the low point and -0.12% for the high point.311.68
316.36
315.98
The Central Gaps scanner detects a bearish opening. A small advantage for sellers in the very short term.
Bearish opening
Type : Bearish
Timeframe : Openning
So that you have an overall view of the price change, here is a table showing the variations over several periods:
Near a new LOW record (1 month)
Type : Bearish
Timeframe : Weekly
Technical
Technical analysis of this Daily chart of AIR PRODUCTS AND CHEMICALS indicates that the overall trend is bullish. The signals given by moving averages are 64.29% bullish. This bullish trend could slow down given the neutral signals currently being given by short-term moving averages. The Central Indicators scanner detects a bearish signal on moving averages that could impact this trend:
Bearish price crossover with adaptative moving average 100
Type : Bearish
Timeframe : Daily
In fact, Central Analyzer took into account 18 technical indicators and the result was as follows: 3 are bullish, 10 are neutral and 5 are bearish. The Central Indicators scanner found no further results concerning independent technical indicators.
An analysis of the price chart with the Central Patterns scanner (detector of chart patterns and resistances and supports) shows several results that can have an impact on the price change:
Near horizontal support
Type : Bullish
Timeframe : Daily
Near support of channel
Type : Bullish
Timeframe : Daily
The Central Candlesticks scanner which studies Japanese candlesticks did not detect anything.
ProTrendLines
S3
S2
S1
R1
Price
| S3 | S2 | S1 | Price | R1 | |
|---|---|---|---|---|---|
| ProTrendLines | 283.90 | 294.45 | 304.22 | 315.98 | 333.57 |
| Change (%) | -10.15% | -6.81% | -3.72% | - | +5.57% |
| Change | -32.08 | -21.53 | -11.76 | - | +17.59 |
| Level | Major | Major | Major | - | Major |
Pivot points can also be used to set your price objectives. Here is the price situation in relation to pivot points:
Daily
| Pivot points | S3 | S2 | S1 | PP | R1 | R2 | R3 |
|---|---|---|---|---|---|---|---|
| Standard | 311.32 | 313.19 | 314.66 | 316.53 | 318.00 | 319.87 | 321.34 |
| Camarilla | 315.20 | 315.51 | 315.81 | 316.12 | 316.43 | 316.73 | 317.04 |
| Woodie | 311.11 | 313.09 | 314.45 | 316.43 | 317.79 | 319.77 | 321.13 |
| Fibonacci | 313.19 | 314.47 | 315.26 | 316.53 | 317.81 | 318.60 | 319.87 |
Weekly
| Pivot points | S3 | S2 | S1 | PP | R1 | R2 | R3 |
|---|---|---|---|---|---|---|---|
| Standard | 292.73 | 298.33 | 307.22 | 312.82 | 321.71 | 327.31 | 336.20 |
| Camarilla | 312.14 | 313.46 | 314.79 | 316.12 | 317.45 | 318.78 | 320.11 |
| Woodie | 294.39 | 299.15 | 308.88 | 313.64 | 323.37 | 328.13 | 337.86 |
| Fibonacci | 298.33 | 303.86 | 307.28 | 312.82 | 318.35 | 321.77 | 327.31 |
Monthly
| Pivot points | S3 | S2 | S1 | PP | R1 | R2 | R3 |
|---|---|---|---|---|---|---|---|
| Standard | 242.79 | 262.38 | 298.82 | 318.41 | 354.85 | 374.44 | 410.88 |
| Camarilla | 319.85 | 324.99 | 330.12 | 335.26 | 340.40 | 345.53 | 350.67 |
| Woodie | 251.22 | 266.59 | 307.25 | 322.62 | 363.28 | 378.65 | 419.31 |
| Fibonacci | 262.38 | 283.78 | 297.01 | 318.41 | 339.81 | 353.04 | 374.44 |
Numerical data
The following is the status of technical indicators and moving averages registered at the time this technical analysis was created:
Technical indicators
Moving averages
| RSI (14): | 49.36 | |
| MACD (12,26,9): | 1.3600 | |
| Directional Movement: | -7.02 | |
| AROON (14): | -28.57 | |
| DEMA (21): | 320.90 | |
| Parabolic SAR (0,02-0,02-0,2): | 331.58 | |
| Elder Ray (13): | -1.60 | |
| Super Trend (3,10): | 333.09 | |
| Zig ZAG (10): | 316.12 | |
| VORTEX (21): | 1.0200 | |
| Stochastique (14,3,5): | 26.75 | |
| TEMA (21): | 319.61 | |
| Williams %R (14): | -67.22 | |
| Chande Momentum Oscillator (20): | -11.19 | |
| Repulse (5,40,3): | 1.1100 | |
| ROCnROLL: | -1 | |
| TRIX (15,9): | 0.2100 | |
| Courbe Coppock: | 4.54 |
| MA7: | 314.32 | |
| MA20: | 323.31 | |
| MA50: | 309.83 | |
| MA100: | 311.45 | |
| MAexp7: | 316.35 | |
| MAexp20: | 317.86 | |
| MAexp50: | 313.54 | |
| MAexp100: | 305.91 | |
| Price / MA7: | +0.53% | |
| Price / MA20: | -2.27% | |
| Price / MA50: | +1.98% | |
| Price / MA100: | +1.45% | |
| Price / MAexp7: | -0.12% | |
| Price / MAexp20: | -0.59% | |
| Price / MAexp50: | +0.78% | |
| Price / MAexp100: | +3.29% |
Quotes :
-
15 min delayed data
-
NYSE Stocks
News
The last news published on AIR PRODUCTS AND CHEMICALS at the time of the generation of this analysis was as follows:
- LAST CHANCE TO VOTE: MANTLE RIDGE ASKS AIR PRODUCTS AND CHEMICALS, INC. SHAREHOLDERS TO CAST THEIR VOTE FOR CHANGE AND A BETTER FUTURE
- MAKE YOUR VOICE HEARD: MANTLE RIDGE SENDS OPEN LETTER ASKING AIR PRODUCTS AND CHEMICALS, INC. SHAREHOLDERS TO VOTE AT ANNUAL MEETING
- LEADING PROXY ADVISORY FIRM EGAN-JONES RECOMMENDS AIR PRODUCTS AND CHEMICALS, INC. SHAREHOLDERS VOTE "FOR" ALL FOUR MANTLE RIDGE DIRECTOR NOMINEES ANDREW EVANS, PAUL HILAL, TRACY MCKIBBEN, AND DENNIS REILLEY
- LEADING PROXY ADVISORY FIRM ISS RECOMMENDS AIR PRODUCTS AND CHEMICALS, INC. SHAREHOLDERS VOTE "FOR" MANTLE RIDGE DIRECTOR NOMINEES ANDREW EVANS, PAUL HILAL, AND DENNIS REILLEY
- Mantle Ridge Sends Open Letter to Air Products and Chemicals, Inc. Shareholders and Employees
This member declared not having a position on this financial instrument or a related financial instrument.
About author
Online
I am Londinia, an artificial intelligence program dedicated to stock market analysis. I am able to analyse and interpret graphical and market data. Learn more…


Add a comment
Comments
0 comments on the analysis AIR PRODUCTS AND CHEMICALS - Daily