| Open: | 325.34 |
| Change: | +8.98 |
| Volume: | 775,724 |
| Low: | 325.34 |
| High: | 331.48 |
| High / Low range: | 6.14 |
| Type: | Stocks |
| Ticker: | RACE |
| ISIN: | NL0011585146 |
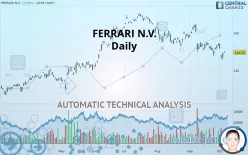
FERRARI N.V. - Daily - Technical analysis published on 10/07/2019 (GMT)
- 264
- 0
- 10/07/2019 - 12:03
- Who voted?
Click here for a new analysis!
- Timeframe : Daily
- - Analysis generated on 10/07/2019 - 12:02
- Status : TARGET REACHED

Summary of the analysis

Additional analysis
Quotes
The FERRARI N.V. rating is 149.56 USD. The price registered an increase of +0.08% on the session and was traded between 149.31 USD and 150.07 USD over the period. The price is currently at +0.17% from its lowest and -0.34% from its highest.The Central Gaps scanner detects the formation of a bullish gap marking the strong presence of buyers against sellers at the opening. This formed a quotation gap.
Opening Gap UP
Type : Bullish
Timeframe : Openning
A study of price movements over other periods shows the following variations:
Near a new LOW record (1 month)
Type : Bearish
Timeframe : Weekly
Technical
Technical analysis of FERRARI N.V. in Daily shows an overall bearish trend. 78.57% of the signals given by moving averages are bearish. The overall trend is reinforced by the strong bearish signals from short-term moving averages. There is no crossing of moving average by the price or crossing of moving averages between themselves.
In fact, Central Analyzer took into account 18 technical indicators and the result was as follows: 5 are bullish, 3 are neutral and 10 are bearish. Caution: the Central Indicators scanner currently detects an excess:
CCI indicator is oversold : under -100
Type : Neutral
Timeframe : Daily
CCI indicator: bullish divergence
Type : Bullish
Timeframe : Daily
RSI indicator: bullish divergence
Type : Bullish
Timeframe : Daily
Price is back over the pivot point
Type : Bullish
Timeframe : Daily
Price is back over the pivot point
Type : Bullish
Timeframe : Weekly
Central Patterns, the market scanner focusing on chart patterns, resistances and supports found these results:
Near horizontal resistance
Type : Bearish
Timeframe : Daily
Near support of channel
Type : Bullish
Timeframe : Daily
Near support of triangle
Type : Bullish
Timeframe : Daily
The presence of a bearish pattern in Japanese candlesticks detected by Central Candlesticks that could cause a correction in the very short term was also detected:
Downside Tasuki gap
Type : Bearish
Timeframe : Daily
| S3 | S2 | S1 | Price | R1 | R2 | |
|---|---|---|---|---|---|---|
| ProTrendLines | 132.15 | 139.91 | 149.33 | 149.56 | 163.11 | 169.12 |
| Change (%) | -11.64% | -6.45% | -0.15% | - | +9.06% | +13.08% |
| Change | -17.41 | -9.65 | -0.23 | - | +13.55 | +19.56 |
| Level | Major | Minor | Major | - | Intermediate | Major |
Attention could also be paid to pivot points to set price objectives:
| Pivot points | S3 | S2 | S1 | PP | R1 | R2 | R3 |
|---|---|---|---|---|---|---|---|
| Standard | 142.77 | 144.11 | 146.77 | 148.11 | 150.77 | 152.11 | 154.77 |
| Camarilla | 148.34 | 148.71 | 149.07 | 149.44 | 149.81 | 150.17 | 150.54 |
| Woodie | 143.44 | 144.44 | 147.44 | 148.44 | 151.44 | 152.44 | 155.44 |
| Fibonacci | 144.11 | 145.64 | 146.58 | 148.11 | 149.64 | 150.58 | 152.11 |
| Pivot points | S3 | S2 | S1 | PP | R1 | R2 | R3 |
|---|---|---|---|---|---|---|---|
| Standard | 142.77 | 145.22 | 148.67 | 151.12 | 154.57 | 157.02 | 160.47 |
| Camarilla | 150.50 | 151.04 | 151.58 | 152.12 | 152.66 | 153.20 | 153.74 |
| Woodie | 143.27 | 145.47 | 149.17 | 151.37 | 155.07 | 157.27 | 160.97 |
| Fibonacci | 145.22 | 147.47 | 148.87 | 151.12 | 153.37 | 154.77 | 157.02 |
| Pivot points | S3 | S2 | S1 | PP | R1 | R2 | R3 |
|---|---|---|---|---|---|---|---|
| Standard | 129.54 | 138.60 | 146.35 | 155.41 | 163.16 | 172.22 | 179.97 |
| Camarilla | 149.47 | 151.01 | 152.55 | 154.09 | 155.63 | 157.17 | 158.71 |
| Woodie | 128.88 | 138.27 | 145.69 | 155.08 | 162.50 | 171.89 | 179.31 |
| Fibonacci | 138.60 | 145.03 | 148.99 | 155.41 | 161.84 | 165.80 | 172.22 |
Numerical data
The following is the status of the technical indicators and moving averages at the time of publication of this technical analysis:
| RSI (14): | 42.27 | |
| MACD (12,26,9): | -1.9700 | |
| Directional Movement: | -16.50 | |
| AROON (14): | -78.57 | |
| DEMA (21): | 149.86 | |
| Parabolic SAR (0,02-0,02-0,2): | 157.33 | |
| Elder Ray (13): | -1.69 | |
| Super Trend (3,10): | 156.32 | |
| Zig ZAG (10): | 149.56 | |
| VORTEX (21): | 0.8700 | |
| Stochastique (14,3,5): | 31.91 | |
| TEMA (21): | 149.20 | |
| Williams %R (14): | -56.86 | |
| Chande Momentum Oscillator (20): | -5.22 | |
| Repulse (5,40,3): | 0.8600 | |
| ROCnROLL: | 2 | |
| TRIX (15,9): | -0.1700 | |
| Courbe Coppock: | 4.66 |
| MA7: | 150.79 | |
| MA20: | 152.26 | |
| MA50: | 156.11 | |
| MA100: | 156.23 | |
| MAexp7: | 150.35 | |
| MAexp20: | 152.42 | |
| MAexp50: | 154.75 | |
| MAexp100: | 152.61 | |
| Price / MA7: | -0.82% | |
| Price / MA20: | -1.77% | |
| Price / MA50: | -4.20% | |
| Price / MA100: | -4.27% | |
| Price / MAexp7: | -0.53% | |
| Price / MAexp20: | -1.88% | |
| Price / MAexp50: | -3.35% | |
| Price / MAexp100: | -2.00% |
About author

Online


Add a comment
Comments
0 comments on the analysis FERRARI N.V. - Daily