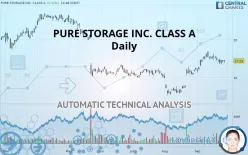
PURE STORAGE INC. CLASS A - Daily - Technical analysis published on 09/27/2019 (GMT)
- 303
- 0
- Who voted?
Click here for a new analysis!
- Timeframe : Daily
- - Analysis generated on
- Status : INVALID

Summary of the analysis

Additional analysis
Quotes
PURE STORAGE INC. CLASS A rating 17.23 USD. On the day, this instrument gained +0.41% with the lowest point at 16.94 USD and the highest point at 17.31 USD. The deviation from the price is +1.71% for the low point and -0.46% for the high point.A bullish opening was detected by the Central Gaps scanner. Buyers are trying to impose a bullish momentum in the very short term.
Bullish opening
Type : Bullish
Timeframe : Openning
So that you have an overall view of the price change, here is a table showing the variations over several periods:
Technical
Technical analysis of this Daily chart of PURE STORAGE INC. CLASS A indicates that the overall trend is bullish. 67.86% of the signals given by moving averages are bullish. The overall trend seems to be showing some signs of weakness, as do the tentative bullish signals given by short-term moving averages. An assessment of moving averages reveals several bearish signals that could impact this trend:
Bearish price crossover with Moving Average 20
Type : Bearish
Timeframe : Daily
Bearish price crossover with adaptative moving average 20
Type : Bearish
Timeframe : Daily
On the 18 technical indicators analysed, 5 are bullish, 6 are neutral and 7 are bearish. Central Indicators, the scanner specialised in technical indicators, has identified this signal:
Aroon indicator bearish trend
Type : Bearish
Timeframe : Daily
An analysis of the price chart with the Central Patterns scanner (detector of chart patterns and resistances and supports) shows several results that can have an impact on the price change:
Near horizontal support
Type : Bullish
Timeframe : Daily
Support of channel is broken
Type : Bearish
Timeframe : Daily
The Central Candlesticks scanner which studies Japanese candlesticks did not detect anything.
| S3 | S2 | S1 | Price | R1 | R2 | R3 | |
|---|---|---|---|---|---|---|---|
| ProTrendLines | 13.01 | 14.85 | 16.96 | 17.23 | 18.35 | 20.46 | 23.38 |
| Change (%) | -24.49% | -13.81% | -1.57% | - | +6.50% | +18.75% | +35.69% |
| Change | -4.22 | -2.38 | -0.27 | - | +1.12 | +3.23 | +6.15 |
| Level | Intermediate | Major | Intermediate | - | Major | Intermediate | Major |
To determine price objectives, it is also possible to use the pivot points. Here is the price position in relation to pivot points:
| Pivot points | S3 | S2 | S1 | PP | R1 | R2 | R3 |
|---|---|---|---|---|---|---|---|
| Standard | 16.67 | 16.83 | 16.99 | 17.15 | 17.32 | 17.48 | 17.64 |
| Camarilla | 17.07 | 17.10 | 17.13 | 17.16 | 17.19 | 17.22 | 17.25 |
| Woodie | 16.67 | 16.83 | 17.00 | 17.15 | 17.32 | 17.48 | 17.65 |
| Fibonacci | 16.83 | 16.95 | 17.03 | 17.15 | 17.28 | 17.35 | 17.48 |
| Pivot points | S3 | S2 | S1 | PP | R1 | R2 | R3 |
|---|---|---|---|---|---|---|---|
| Standard | 16.00 | 16.60 | 16.99 | 17.59 | 17.98 | 18.58 | 18.97 |
| Camarilla | 17.12 | 17.21 | 17.30 | 17.39 | 17.48 | 17.57 | 17.66 |
| Woodie | 15.91 | 16.55 | 16.90 | 17.54 | 17.89 | 18.53 | 18.88 |
| Fibonacci | 16.60 | 16.98 | 17.21 | 17.59 | 17.97 | 18.20 | 18.58 |
| Pivot points | S3 | S2 | S1 | PP | R1 | R2 | R3 |
|---|---|---|---|---|---|---|---|
| Standard | 10.07 | 11.37 | 13.83 | 15.13 | 17.58 | 18.88 | 21.34 |
| Camarilla | 15.25 | 15.59 | 15.94 | 16.28 | 16.62 | 16.97 | 17.31 |
| Woodie | 10.65 | 11.66 | 14.40 | 15.42 | 18.16 | 19.17 | 21.91 |
| Fibonacci | 11.37 | 12.81 | 13.69 | 15.13 | 16.56 | 17.45 | 18.88 |
Numerical data
The following is the status of the technical indicators and moving averages at the time of publication of this technical analysis:
| RSI (14): | 56.82 | |
| MACD (12,26,9): | 0.4500 | |
| Directional Movement: | 8.20 | |
| AROON (14): | -64.28 | |
| DEMA (21): | 17.69 | |
| Parabolic SAR (0,02-0,02-0,2): | 17.90 | |
| Elder Ray (13): | -0.12 | |
| Super Trend (3,10): | 16.25 | |
| Zig ZAG (10): | 17.21 | |
| VORTEX (21): | 1.0700 | |
| Stochastique (14,3,5): | 28.07 | |
| TEMA (21): | 17.75 | |
| Williams %R (14): | -70.98 | |
| Chande Momentum Oscillator (20): | -0.94 | |
| Repulse (5,40,3): | 0.7100 | |
| ROCnROLL: | -1 | |
| TRIX (15,9): | 0.6000 | |
| Courbe Coppock: | 3.31 |
| MA7: | 17.28 | |
| MA20: | 17.30 | |
| MA50: | 15.68 | |
| MA100: | 16.25 | |
| MAexp7: | 17.28 | |
| MAexp20: | 17.01 | |
| MAexp50: | 16.41 | |
| MAexp100: | 16.79 | |
| Price / MA7: | -0.29% | |
| Price / MA20: | -0.40% | |
| Price / MA50: | +9.89% | |
| Price / MA100: | +6.03% | |
| Price / MAexp7: | -0.29% | |
| Price / MAexp20: | +1.29% | |
| Price / MAexp50: | +5.00% | |
| Price / MAexp100: | +2.62% |
News
The last news published on PURE STORAGE INC. CLASS A at the time of the generation of this analysis was as follows:
- Pure Storage Named as a Leader in New Gartner Magic Quadrant for Primary Storage
- Sirius Receives Recognition from Pure Storage at Pure//Accelerate 2019
- Cloudian Integrates Object Storage with Pure Storage’s Purity CloudSnap for Protecting FlashArray Datasets
- Veritas and Pure Storage Extend Collaboration to Reduce Downtime for Mission Critical Applications and Services
- Micro Focus Announces Vertica in Eon Mode for Pure Storage
About author

Online


Add a comment
Comments
0 comments on the analysis PURE STORAGE INC. CLASS A - Daily