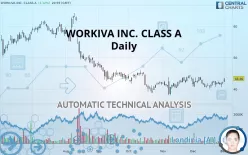
WORKIVA INC. CLASS A - Daily - Technical analysis published on 01/03/2020 (GMT)
- 375
- 0
- Who voted?
Click here for a new analysis!
- Timeframe : Daily
- - Analysis generated on
- Status : TARGET REACHED

Summary of the analysis

Additional analysis
Quotes
The WORKIVA INC. CLASS A price is 43.36 USD. The price has increased by +3.12% since the last closing and was traded between 42.25 USD and 43.40 USD over the period. The price is currently at +2.63% from its lowest and -0.09% from its highest.The Central Gaps scanner detects a bullish gap which is a sign that buyers have taken the lead in the very short term.
Opening Gap UP
Type : Bullish
Timeframe : Openning
So that you have an overall view of the price change, here is a table showing the variations over several periods:
Near a new LOW record (1 month)
Type : Bearish
Timeframe : Weekly
Technical
A technical analysis in Daily of this WORKIVA INC. CLASS A chart shows a neutral trend. The trend could quickly turn bullish due to the strong bullish signals currently being given by short-term moving averages. An assessment of moving averages reveals a bullish signal that could impact this trend:
Bullish trend reversal : Moving Average 20
Type : Bullish
Timeframe : Daily
An assessment of technical indicators shows a strong bullish signal.
Caution: the Central Indicators scanner currently detects an excess:
Williams %R indicator is overbought : over -20
Type : Neutral
Timeframe : Daily
Pivot points : price is over resistance 2
Type : Neutral
Timeframe : Weekly
Pivot points : price is over resistance 3
Type : Neutral
Timeframe : Daily
Parabolic SAR indicator bullish reversal
Type : Bullish
Timeframe : Daily
Ichimoku : price is over the cloud
Type : Bullish
Timeframe : Daily
Price is back under the pivot point
Type : Bearish
Timeframe : Weekly
Central Patterns, the market scanner focusing on chart patterns, resistances and supports found this result:
Near resistance of triangle
Type : Bearish
Timeframe : Daily
The Central Candlesticks scanner which studies Japanese candlesticks did not detect anything.
| S3 | S2 | S1 | Price | R1 | R2 | R3 | |
|---|---|---|---|---|---|---|---|
| ProTrendLines | 22.92 | 32.43 | 38.49 | 43.36 | 44.01 | 50.84 | 55.54 |
| Change (%) | -47.14% | -25.21% | -11.23% | - | +1.50% | +17.25% | +28.09% |
| Change | -20.44 | -10.93 | -4.87 | - | +0.65 | +7.48 | +12.18 |
| Level | Minor | Minor | Major | - | Major | Intermediate | Minor |
To determine price objectives, it is also possible to use the pivot points. Here is the price position in relation to pivot points:
| Pivot points | S3 | S2 | S1 | PP | R1 | R2 | R3 |
|---|---|---|---|---|---|---|---|
| Standard | 41.14 | 41.41 | 41.73 | 42.00 | 42.32 | 42.59 | 42.91 |
| Camarilla | 41.89 | 41.94 | 42.00 | 42.05 | 42.10 | 42.16 | 42.21 |
| Woodie | 41.17 | 41.42 | 41.76 | 42.01 | 42.35 | 42.60 | 42.94 |
| Fibonacci | 41.41 | 41.64 | 41.78 | 42.00 | 42.23 | 42.37 | 42.59 |
| Pivot points | S3 | S2 | S1 | PP | R1 | R2 | R3 |
|---|---|---|---|---|---|---|---|
| Standard | 39.04 | 39.90 | 40.74 | 41.60 | 42.44 | 43.30 | 44.14 |
| Camarilla | 41.12 | 41.28 | 41.43 | 41.59 | 41.75 | 41.90 | 42.06 |
| Woodie | 39.04 | 39.90 | 40.74 | 41.60 | 42.44 | 43.30 | 44.14 |
| Fibonacci | 39.90 | 40.55 | 40.95 | 41.60 | 42.25 | 42.65 | 43.30 |
| Pivot points | S3 | S2 | S1 | PP | R1 | R2 | R3 |
|---|---|---|---|---|---|---|---|
| Standard | 36.43 | 38.29 | 40.17 | 42.03 | 43.91 | 45.77 | 47.65 |
| Camarilla | 41.02 | 41.36 | 41.71 | 42.05 | 42.39 | 42.74 | 43.08 |
| Woodie | 36.44 | 38.30 | 40.18 | 42.04 | 43.92 | 45.78 | 47.66 |
| Fibonacci | 38.29 | 39.72 | 40.60 | 42.03 | 43.46 | 44.34 | 45.77 |
Numerical data
The following is the status of technical indicators and moving averages registered at the time this technical analysis was created:
| RSI (14): | 58.79 | |
| MACD (12,26,9): | 0.0300 | |
| Directional Movement: | 1.32 | |
| AROON (14): | 71.43 | |
| DEMA (21): | 42.01 | |
| Parabolic SAR (0,02-0,02-0,2): | 40.19 | |
| Elder Ray (13): | 0.77 | |
| Super Trend (3,10): | 44.25 | |
| Zig ZAG (10): | 43.36 | |
| VORTEX (21): | 1.0500 | |
| Stochastique (14,3,5): | 80.75 | |
| TEMA (21): | 42.21 | |
| Williams %R (14): | -1.23 | |
| Chande Momentum Oscillator (20): | 2.55 | |
| Repulse (5,40,3): | 4.4600 | |
| ROCnROLL: | 1 | |
| TRIX (15,9): | -0.0300 | |
| Courbe Coppock: | 0.84 |
| MA7: | 42.03 | |
| MA20: | 41.92 | |
| MA50: | 41.79 | |
| MA100: | 43.95 | |
| MAexp7: | 42.23 | |
| MAexp20: | 42.03 | |
| MAexp50: | 42.54 | |
| MAexp100: | 44.38 | |
| Price / MA7: | +3.16% | |
| Price / MA20: | +3.44% | |
| Price / MA50: | +3.76% | |
| Price / MA100: | -1.34% | |
| Price / MAexp7: | +2.68% | |
| Price / MAexp20: | +3.16% | |
| Price / MAexp50: | +1.93% | |
| Price / MAexp100: | -2.30% |
News
The latest news and videos published on WORKIVA INC. CLASS A at the time of the analysis were as follows:
- Workiva Recognized Again as a Gartner Peer Insights Customers’ Choice for Cloud Financial Planning & Analysis
- Workiva Named Large Software Company of the Year by International Business Awards®
- Workiva Receives FedRAMP Moderate Authorization
- Workiva to Report Third Quarter 2019 Results
- Workiva Applauds Bipartisan Introduction of the Financial Transparency Act in the U.S. House of Representatives
About author

Online


Add a comment
Comments
0 comments on the analysis WORKIVA INC. CLASS A - Daily