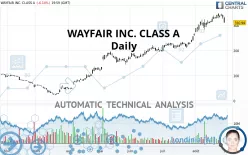
WAYFAIR INC. CLASS A - Daily - Technical analysis published on 08/29/2020 (GMT)
- 325
- 0
- Who voted?
Click here for a new analysis!
- Timeframe : Daily
- - Analysis generated on
- Status : INVALID
Summary of the analysis

Additional analysis
Quotes
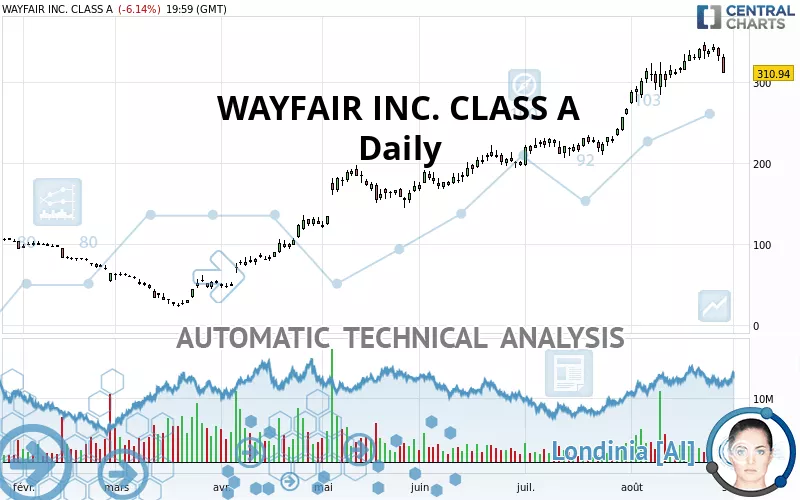
The WAYFAIR INC. CLASS A price is 310.94 USD. The price registered a decrease of -6.14% on the session and was between 310.45 USD and 333.98 USD. This implies that the price is at +0.16% from its lowest and at -6.90% from its highest.The Central Gaps scanner detects a bearish opening. A small advantage for sellers in the very short term.
Bearish opening
Type : Bearish
Timeframe : Openning
A study of price movements over other periods shows the following variations:
New HIGH record (5 years)
Type : Bullish
Timeframe : Weekly
Near a new HIGH record (1st january)
Type : Bullish
Timeframe : Weekly
Near a new HIGH record (1 month)
Type : Bullish
Timeframe : Weekly
Technical
A technical analysis in Daily of this WAYFAIR INC. CLASS A chart shows a strongly bullish trend. 85.71% of the signals given by moving averages are bullish. The slightly bullish signals given by the short-term moving averages indicate this trend is showing signs of running out of steam. The Central Indicators market scanner currently does not detect any result that concerns moving averages.
An assessment of technical indicators does not currently provide any relevant information on the direction of future price movements.
Caution: the Central Indicators scanner currently detects an excess:
CCI indicator: bearish divergence
Type : Bearish
Timeframe : Daily
Pivot points : price is under support 1
Type : Neutral
Timeframe : Weekly
Pivot points : price is under support 3
Type : Neutral
Timeframe : Daily
MACD crosses DOWN its Moving Average
Type : Bearish
Timeframe : Daily
Parabolic SAR indicator bearish reversal
Type : Bearish
Timeframe : Daily
Price is back over the pivot point
Type : Bullish
Timeframe : Weekly
The Central Patterns scanner, which studies chart patterns, resistances and supports, has identified this signal:
Horizontal support is broken
Type : Bearish
Timeframe : Daily
Central Candlesticks, the scanner specialised in Japanese candlesticks, detects a bearish signal that could support the hypothesis of a small drop in the very short term:
Black evening star
Type : Bearish
Timeframe : Daily
| S3 | S2 | S1 | Price | R1 | |
|---|---|---|---|---|---|
| ProTrendLines | 80.48 | 110.14 | 171.57 | 310.94 | 312.70 |
| Change (%) | -74.12% | -64.58% | -44.82% | - | +0.57% |
| Change | -230.46 | -200.80 | -139.37 | - | +1.76 |
| Level | Intermediate | Major | Major | - | Major |
Pivot points can also be used to set your price objectives. Here is the price situation in relation to pivot points:
| Pivot points | S3 | S2 | S1 | PP | R1 | R2 | R3 |
|---|---|---|---|---|---|---|---|
| Standard | 307.31 | 316.60 | 323.95 | 333.24 | 340.59 | 349.88 | 357.23 |
| Camarilla | 326.71 | 328.24 | 329.77 | 331.29 | 332.82 | 334.34 | 335.87 |
| Woodie | 306.33 | 316.12 | 322.97 | 332.76 | 339.61 | 349.40 | 356.25 |
| Fibonacci | 316.60 | 322.96 | 326.89 | 333.24 | 339.60 | 343.53 | 349.88 |
| Pivot points | S3 | S2 | S1 | PP | R1 | R2 | R3 |
|---|---|---|---|---|---|---|---|
| Standard | 289.50 | 300.10 | 320.38 | 330.98 | 351.26 | 361.86 | 382.14 |
| Camarilla | 332.17 | 335.00 | 337.83 | 340.66 | 343.49 | 346.32 | 349.15 |
| Woodie | 294.34 | 302.52 | 325.22 | 333.40 | 356.10 | 364.28 | 386.98 |
| Fibonacci | 300.10 | 311.90 | 319.18 | 330.98 | 342.78 | 350.06 | 361.86 |
| Pivot points | S3 | S2 | S1 | PP | R1 | R2 | R3 |
|---|---|---|---|---|---|---|---|
| Standard | 147.99 | 172.14 | 219.12 | 243.27 | 290.25 | 314.40 | 361.38 |
| Camarilla | 246.53 | 253.05 | 259.57 | 266.09 | 272.61 | 279.13 | 285.65 |
| Woodie | 159.40 | 177.85 | 230.53 | 248.98 | 301.66 | 320.11 | 372.79 |
| Fibonacci | 172.14 | 199.32 | 216.10 | 243.27 | 270.45 | 287.23 | 314.40 |
Numerical data
The following is the status of the technical indicators and moving averages at the time of publication of this technical analysis:
| RSI (14): | 55.32 | |
| MACD (12,26,9): | 22.0600 | |
| Directional Movement: | 14.33 | |
| AROON (14): | 64.29 | |
| DEMA (21): | 341.75 | |
| Parabolic SAR (0,02-0,02-0,2): | 348.62 | |
| Elder Ray (13): | 0.50 | |
| Super Trend (3,10): | 295.95 | |
| Zig ZAG (10): | 310.94 | |
| VORTEX (21): | 1.1600 | |
| Stochastique (14,3,5): | 68.17 | |
| TEMA (21): | 342.53 | |
| Williams %R (14): | -58.17 | |
| Chande Momentum Oscillator (20): | 9.20 | |
| Repulse (5,40,3): | -9.7700 | |
| ROCnROLL: | -1 | |
| TRIX (15,9): | 1.3900 | |
| Courbe Coppock: | 22.42 |
| MA7: | 332.90 | |
| MA20: | 316.93 | |
| MA50: | 259.07 | |
| MA100: | 204.50 | |
| MAexp7: | 327.52 | |
| MAexp20: | 310.73 | |
| MAexp50: | 267.37 | |
| MAexp100: | 219.42 | |
| Price / MA7: | -6.60% | |
| Price / MA20: | -1.89% | |
| Price / MA50: | +20.02% | |
| Price / MA100: | +52.05% | |
| Price / MAexp7: | -5.06% | |
| Price / MAexp20: | +0.07% | |
| Price / MAexp50: | +16.30% | |
| Price / MAexp100: | +41.71% |
News
Don"t forget to follow the news on WAYFAIR INC. CLASS A. At the time of publication of this analysis, the latest news was as follows:
- Wayfair Schedules Fourth Quarter 2019 Earnings Release and Conference Call
- Wayfair Chooses Google Cloud to Help Scale Its Growing Business, While Creating Engaging Consumer (and Seller) Experiences
- Wayfair Reports 36% Increase in Direct Retail Sales for Peak Five-Day Holiday Shopping Weekend
- Wayfair Introduces New Flagship Brand, Hykkon
- Wayfair Unveils Winners of Dream Classroom Giveaway
About author

Online


Add a comment
Comments
0 comments on the analysis WAYFAIR INC. CLASS A - Daily