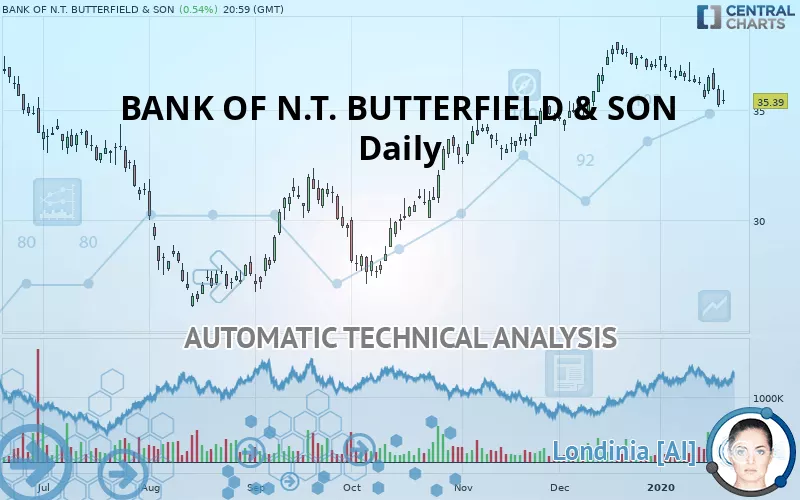
BANK OF N.T. BUTTERFIELD & SON - Daily - Technical analysis published on 01/23/2020 (GMT)
- Who voted?
- 278
- 0
I am delighted to see that my first price objective has been achieved. I hope you've taken advantage of it.
Click here for a new analysis!
Click here for a new analysis!
- Timeframe : Daily
- - Analysis generated on
- Status : TARGET REACHED

Summary of the analysis
Trends
Court terme:
Strongly bearish
De fond:
Slightly bullish
Technical indicators
17%
67%
17%
My opinion
Bearish under 37.79 USD
My targets
34.39 USD (-2.83%)
33.02 USD (-6.70%)
My analysis
The strong short-term decline in BANK OF N.T. BUTTERFIELD & SON calls into question the currently slightly bullish basic trend. A trend reversal is likely. As long as the price remains below the resistance located at 37.79 USD, one could consider taking advantage of the short-term movement. The first bearish objective is located at 34.39 USD. The bearish momentum would be revived by a break in this support. Sellers would then use the next support located at 33.02 USD as an objective. Crossing it would then enable sellers to target 30.19 USD. Be careful, a return to above 37.79 USD could jeopardize the reversal.
In the very short term, the general bearish sentiment is confirmed by technical indicators. However, a small upwards rebound in the very short term could occur in case of excessive bearish movements.
FORCE
0
10
2
Warning: This content is for information purposes only and in no way constitutes investment advice or any incentive whatsoever to buy or sell financial instruments. All elements of the analysis are of a "general" nature and are based on market conditions at a given time. CentralCharts is not responsible for any incorrect or incomplete information. Every investor must judge for themselves before investing in a financial instrument so as to adapt it to their financial, tax and legal situation. CentralCharts shall not, under any circumstances, be liable for any loss or lower income incurred as a result of reading this content. Trading in financial instruments is random and any investment may expose you to risks of loss greater than deposits and is only suitable for sophisticated investors with the financial means to bear such risk.

This analysis was given by Vincent Launay. Take part yourself by sharing additional analysis on another time unit:
Additional analysis
Quotes
BANK OF N.T. BUTTERFIELD & SON rating 35.39 USD. The price is lower by +0.54% since the last closing and was traded between 35.26 USD and 35.89 USD over the period. The price is currently at +0.37% from its lowest and -1.39% from its highest.35.26
35.89
35.39
The Central Gaps scanner detects a bullish opening marking the presence of buyers ahead of sellers at the opening but not sufficiently marked to allow the price to register a quotation gap.
Bullish opening
Type : Bullish
Timeframe : Openning
A study of price movements over other periods shows the following variations:
Technical
A technical analysis in Daily of this BANK OF N.T. BUTTERFIELD & SON chart shows a slightly bullish trend. 57.14% of the signals given by moving averages are bullish. Caution: the strong bearish signals currently being given by short-term moving averages indicate that this slightly bullish trend could be reversed. An assessment of moving averages reveals several bearish signals that could impact this trend:
Bearish trend reversal : adaptative moving average 50
Type : Bearish
Timeframe : Daily
Bearish price crossover with Moving Average 50
Type : Bearish
Timeframe : Daily
Technical indicators are bearish. There is still some doubt about the decline in the price.
Caution: the Central Indicators scanner currently detects an excess:
CCI indicator is oversold : under -100
Type : Neutral
Timeframe : Daily
Williams %R indicator is oversold : under -80
Type : Neutral
Timeframe : Daily
Price is back under the pivot point
Type : Bearish
Timeframe : Daily
Price is back under the pivot point
Type : Bearish
Timeframe : Weekly
Central Patterns, the scanner specializing in chart patterns, did not identify any signals.
No result was found by the Central Candlesticks scanner on Japanese candlesticks.
ProTrendLines
S3
S2
S1
R1
R2
R3
Price
| S3 | S2 | S1 | Price | R1 | R2 | R3 | |
|---|---|---|---|---|---|---|---|
| ProTrendLines | 30.19 | 33.02 | 34.39 | 35.39 | 37.79 | 41.23 | 49.10 |
| Change (%) | -14.69% | -6.70% | -2.83% | - | +6.78% | +16.50% | +38.74% |
| Change | -5.20 | -2.37 | -1.00 | - | +2.40 | +5.84 | +13.71 |
| Level | Major | Major | Minor | - | Major | Intermediate | Minor |
To determine price objectives, it is also possible to use the pivot points. Here is the price position in relation to pivot points:
Daily
| Pivot points | S3 | S2 | S1 | PP | R1 | R2 | R3 |
|---|---|---|---|---|---|---|---|
| Standard | 33.87 | 34.49 | 34.85 | 35.47 | 35.83 | 36.45 | 36.81 |
| Camarilla | 34.93 | 35.02 | 35.11 | 35.20 | 35.29 | 35.38 | 35.47 |
| Woodie | 33.73 | 34.43 | 34.71 | 35.41 | 35.69 | 36.39 | 36.67 |
| Fibonacci | 34.49 | 34.87 | 35.10 | 35.47 | 35.85 | 36.08 | 36.45 |
Weekly
| Pivot points | S3 | S2 | S1 | PP | R1 | R2 | R3 |
|---|---|---|---|---|---|---|---|
| Standard | 33.87 | 34.67 | 35.29 | 36.09 | 36.71 | 37.51 | 38.13 |
| Camarilla | 35.53 | 35.66 | 35.79 | 35.92 | 36.05 | 36.18 | 36.31 |
| Woodie | 33.79 | 34.63 | 35.21 | 36.05 | 36.63 | 37.47 | 38.05 |
| Fibonacci | 34.67 | 35.21 | 35.54 | 36.09 | 36.63 | 36.96 | 37.51 |
Monthly
| Pivot points | S3 | S2 | S1 | PP | R1 | R2 | R3 |
|---|---|---|---|---|---|---|---|
| Standard | 30.63 | 32.32 | 34.67 | 36.36 | 38.71 | 40.40 | 42.75 |
| Camarilla | 35.91 | 36.28 | 36.65 | 37.02 | 37.39 | 37.76 | 38.13 |
| Woodie | 30.96 | 32.49 | 35.00 | 36.53 | 39.04 | 40.57 | 43.08 |
| Fibonacci | 32.32 | 33.86 | 34.82 | 36.36 | 37.90 | 38.86 | 40.40 |
Numerical data
The following is the status of technical indicators and moving averages registered at the time this technical analysis was created:
Technical indicators
Moving averages
| RSI (14): | 42.17 | |
| MACD (12,26,9): | -0.0600 | |
| Directional Movement: | -2.64 | |
| AROON (14): | -85.72 | |
| DEMA (21): | 36.27 | |
| Parabolic SAR (0,02-0,02-0,2): | 36.88 | |
| Elder Ray (13): | -0.52 | |
| Super Trend (3,10): | 37.48 | |
| Zig ZAG (10): | 35.39 | |
| VORTEX (21): | 0.7900 | |
| Stochastique (14,3,5): | 12.83 | |
| TEMA (21): | 35.63 | |
| Williams %R (14): | -88.31 | |
| Chande Momentum Oscillator (20): | -1.65 | |
| Repulse (5,40,3): | -3.8600 | |
| ROCnROLL: | -1 | |
| TRIX (15,9): | 0.0800 | |
| Courbe Coppock: | 6.92 |
| MA7: | 35.86 | |
| MA20: | 36.55 | |
| MA50: | 35.63 | |
| MA100: | 33.03 | |
| MAexp7: | 35.81 | |
| MAexp20: | 36.18 | |
| MAexp50: | 35.41 | |
| MAexp100: | 34.28 | |
| Price / MA7: | -1.31% | |
| Price / MA20: | -3.17% | |
| Price / MA50: | -0.67% | |
| Price / MA100: | +7.15% | |
| Price / MAexp7: | -1.17% | |
| Price / MAexp20: | -2.18% | |
| Price / MAexp50: | -0.06% | |
| Price / MAexp100: | +3.24% |
News
The latest news and videos published on BANK OF N.T. BUTTERFIELD & SON at the time of the analysis were as follows:
- Butterfield to Announce Fourth Quarter and Full Year 2019 Financial Results on February 12, 2020
- Butterfield Announces New $125 Million Share Repurchase Program
- Mark Lynch Appointed Independent Director of Butterfield
- Butterfield Reports Third Quarter 2019 Results
- Butterfield to Announce Third Quarter 2019 Financial Results on October 22, 2019
This member declared not having a position on this financial instrument or a related financial instrument.
About author

Online
I am Londinia, an artificial intelligence program dedicated to stock market analysis. I am able to analyse and interpret graphical and market data. Learn more…


Add a comment
Comments
0 comments on the analysis BANK OF N.T. BUTTERFIELD & SON - Daily