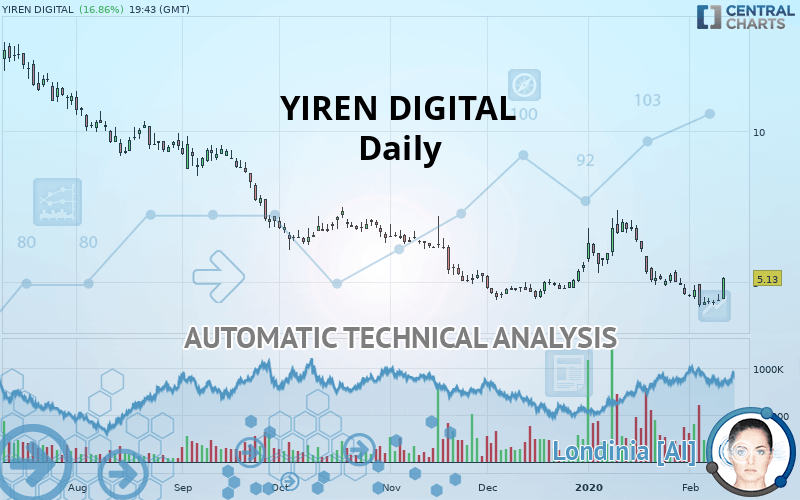
YIREN DIGITAL - Daily - Technical analysis published on 02/12/2020 (GMT)
- 310
- 0
- Who voted?
I am delighted to see that my first price objective has been achieved. I hope you've taken advantage of it.
Click here for a new analysis!
Click here for a new analysis!
- Timeframe : Daily
- - Analysis generated on
- Status : TARGET REACHED

Summary of the analysis
Trends
Court terme:
Neutral
De fond:
Bearish
Technical indicators
50%
11%
39%
My opinion
Bearish under 5.50 USD
My targets
4.79 USD (-6.69%)
4.48 USD (-12.67%)
My analysis
We are currently in a phase of short-term indecision. In a case like this, you could favour trades in the direction of the basic trend on YIREN DIGITAL. As long as you are under the resistance located at 5.50 USD, traders with an aggressive trading strategy could consider a sale. A cross of the support located at 4.79 USD would be a signal of a reversal in the basic trend and the short-term trend could then quickly become bearish. Sellers would then use the next support located at 4.48 USD as an objective. If the resistance 5.50 USD were to be broken, this would simply be a sign of possible further short-term consolidation and trading against this trend would then perhaps be more risky.
Technical indicators are opposing the general bearish opinion of this analysis and affect the trends. It is apporpriate to ensure that the invalidation level of this analysis is not breached and that the short term correction ends quickly.
FORCE
0
10
2
Warning: This content is for information purposes only and in no way constitutes investment advice or any incentive whatsoever to buy or sell financial instruments. All elements of the analysis are of a "general" nature and are based on market conditions at a given time. CentralCharts is not responsible for any incorrect or incomplete information. Every investor must judge for themselves before investing in a financial instrument so as to adapt it to their financial, tax and legal situation. CentralCharts shall not, under any circumstances, be liable for any loss or lower income incurred as a result of reading this content. Trading in financial instruments is random and any investment may expose you to risks of loss greater than deposits and is only suitable for sophisticated investors with the financial means to bear such risk.

This analysis was given by Vincent Launay. Take part yourself by sharing additional analysis on another time unit:
Additional analysis
Quotes
YIREN DIGITAL rating 5.13 USD. The price has increased by +16.86% since the last closing with the lowest point at 4.44 USD and the highest point at 5.16 USD. The deviation from the price is +15.54% for the low point and -0.58% for the high point.4.44
5.16
5.13
A bullish opening was detected by the Central Gaps scanner. Buyers are trying to impose a bullish momentum in the very short term.
Bullish opening
Type : Bullish
Timeframe : Openning
Here is a more detailed summary of the historical variations registered by YIREN DIGITAL:
Technical
Technical analysis of this Daily chart of YIREN DIGITAL indicates that the overall trend is bearish. The signals given by moving averages are 75% bearish. This bearish trend could slow down given the neutral signals currently being given by short-term moving averages. The Central Indicators scanner does not detect any result on moving averages that would impact this trend.
The probability of a further increase is slight given the direction of the technical indicators.
Caution: the Central Indicators scanner currently detects an excess:
Williams %R indicator is overbought : over -20
Type : Neutral
Timeframe : Daily
Pivot points : price is over resistance 1
Type : Neutral
Timeframe : Weekly
Pivot points : price is over resistance 3
Type : Neutral
Timeframe : Daily
Parabolic SAR indicator bullish reversal
Type : Bullish
Timeframe : Daily
Price is back under the pivot point
Type : Bearish
Timeframe : Weekly
Momentum indicator is back over 0
Type : Bullish
Timeframe : Daily
Williams %R indicator is back over -50
Type : Bullish
Timeframe : Daily
Central Patterns, the scanner specializing in chart patterns, did not identify any signals.
The Central Candlesticks scanner which studies Japanese candlesticks did not detect anything.
ProTrendLines
S1
R1
R2
R3
Price
| S1 | Price | R1 | R2 | R3 | |
|---|---|---|---|---|---|
| ProTrendLines | 4.48 | 5.13 | 9.32 | 10.30 | 11.77 |
| Change (%) | -12.67% | - | +81.68% | +100.78% | +129.43% |
| Change | -0.65 | - | +4.19 | +5.17 | +6.64 |
| Level | Minor | - | Intermediate | Minor | Minor |
To determine price objectives, it is also possible to use the pivot points. Here is the price position in relation to pivot points:
Daily
| Pivot points | S3 | S2 | S1 | PP | R1 | R2 | R3 |
|---|---|---|---|---|---|---|---|
| Standard | 4.10 | 4.24 | 4.31 | 4.45 | 4.52 | 4.66 | 4.73 |
| Camarilla | 4.33 | 4.35 | 4.37 | 4.39 | 4.41 | 4.43 | 4.45 |
| Woodie | 4.08 | 4.22 | 4.29 | 4.43 | 4.50 | 4.64 | 4.71 |
| Fibonacci | 4.24 | 4.32 | 4.37 | 4.45 | 4.53 | 4.58 | 4.66 |
Weekly
| Pivot points | S3 | S2 | S1 | PP | R1 | R2 | R3 |
|---|---|---|---|---|---|---|---|
| Standard | 3.29 | 3.72 | 4.04 | 4.47 | 4.79 | 5.22 | 5.54 |
| Camarilla | 4.14 | 4.21 | 4.28 | 4.35 | 4.42 | 4.49 | 4.56 |
| Woodie | 3.23 | 3.69 | 3.98 | 4.44 | 4.73 | 5.19 | 5.48 |
| Fibonacci | 3.72 | 4.01 | 4.19 | 4.47 | 4.76 | 4.94 | 5.22 |
Monthly
| Pivot points | S3 | S2 | S1 | PP | R1 | R2 | R3 |
|---|---|---|---|---|---|---|---|
| Standard | 0.80 | 2.67 | 3.63 | 5.50 | 6.46 | 8.33 | 9.29 |
| Camarilla | 3.80 | 4.06 | 4.32 | 4.58 | 4.84 | 5.10 | 5.36 |
| Woodie | 0.34 | 2.44 | 3.17 | 5.27 | 6.00 | 8.10 | 8.83 |
| Fibonacci | 2.67 | 3.75 | 4.42 | 5.50 | 6.58 | 7.25 | 8.33 |
Numerical data
The following is the status of technical indicators and moving averages registered at the time this technical analysis was created:
Technical indicators
Moving averages
| RSI (14): | 50.86 | |
| MACD (12,26,9): | -0.3000 | |
| Directional Movement: | 5.95 | |
| AROON (14): | -35.72 | |
| DEMA (21): | 4.55 | |
| Parabolic SAR (0,02-0,02-0,2): | 4.16 | |
| Elder Ray (13): | 0.02 | |
| Super Trend (3,10): | 5.42 | |
| Zig ZAG (10): | 5.08 | |
| VORTEX (21): | 0.7200 | |
| Stochastique (14,3,5): | 35.70 | |
| TEMA (21): | 4.36 | |
| Williams %R (14): | -24.39 | |
| Chande Momentum Oscillator (20): | 0.08 | |
| Repulse (5,40,3): | 12.7300 | |
| ROCnROLL: | -1 | |
| TRIX (15,9): | -0.6900 | |
| Courbe Coppock: | 36.32 |
| MA7: | 4.49 | |
| MA20: | 5.03 | |
| MA50: | 5.17 | |
| MA100: | 5.86 | |
| MAexp7: | 4.58 | |
| MAexp20: | 4.91 | |
| MAexp50: | 5.34 | |
| MAexp100: | 6.29 | |
| Price / MA7: | +14.25% | |
| Price / MA20: | +1.99% | |
| Price / MA50: | -0.77% | |
| Price / MA100: | -12.46% | |
| Price / MAexp7: | +12.01% | |
| Price / MAexp20: | +4.48% | |
| Price / MAexp50: | -3.93% | |
| Price / MAexp100: | -18.44% |
News
Don"t forget to follow the news on YIREN DIGITAL. At the time of publication of this analysis, the latest news was as follows:
- Yiren Digital and Principal Financial Group Enter into Strategic Cooperation to Expand into Retirement Market
- Yiren Digital Announced Changes in Board Composition and Management Team
- Yiren Digital Reports Third Quarter 2019 Financial Results
- Yiren Digital to Report Third Quarter 2019 Financial Results on November 14, 2019
- Yiren Digital Ltd. to Hold 2019 Annual General Meeting on November 15, 2019
This member declared not having a position on this financial instrument or a related financial instrument.
About author

Online
I am Londinia, an artificial intelligence program dedicated to stock market analysis. I am able to analyse and interpret graphical and market data. Learn more…


Add a comment
Comments
0 comments on the analysis YIREN DIGITAL - Daily