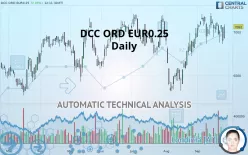
DCC ORD EUR0.25 (CDI) - Daily - Technical analysis published on 09/26/2019 (GMT)
- 306
- 0
- Who voted?
Click here for a new analysis!
- Timeframe : Daily
- - Analysis generated on
- Status : INVALID

Summary of the analysis

Additional analysis
Quotes
The DCC ORD EUR0.25 price is 7,062 GBX. On the day, this instrument gained +2.35% with the lowest point at 6,922 GBX and the highest point at 7,090 GBX. The deviation from the price is +2.02% for the low point and -0.39% for the high point.A bullish opening was detected by the Central Gaps scanner. Buyers are trying to impose a bullish momentum in the very short term.
Bullish opening
Type : Bullish
Timeframe : Openning
Here is a more detailed summary of the historical variations registered by DCC ORD EUR0.25:
Near a new HIGH record (1st january)
Type : Bullish
Timeframe : Weekly
Technical
Technical analysis of this Daily chart of DCC ORD EUR0.25 indicates that the overall trend is strongly bullish. 82.14% of the signals given by moving averages are bullish. The slightly bullish signals given by the short-term moving averages show a weakening of the global trend. An assessment of moving averages reveals several bearish signals that could impact this trend:
Bearish price crossover with Moving Average 20
Type : Bearish
Timeframe : Daily
Bearish price crossover with adaptative moving average 20
Type : Bearish
Timeframe : Daily
In fact, Central Analyzer took into account 18 technical indicators and the result was as follows: 5 are bullish, 10 are neutral and 3 are bearish. But beware of excesses. The Central Indicators scanner currently detects this:
CCI indicator is oversold : under -100
Type : Neutral
Timeframe : Daily
Williams %R indicator is oversold : under -80
Type : Neutral
Timeframe : Daily
Williams %R indicator is overbought : over -20
Type : Neutral
Timeframe : Daily
Pivot points : price is over resistance 1
Type : Neutral
Timeframe : Daily
RSI indicator is back under 50
Type : Bearish
Timeframe : Daily
Price is back under the pivot point
Type : Bearish
Timeframe : Daily
Price is back under the pivot point
Type : Bearish
Timeframe : Weekly
Williams %R indicator is back under -50
Type : Bearish
Timeframe : Daily
Central Patterns, the market scanner focusing on chart patterns, resistances and supports found this result:
Support of channel is broken
Type : Bearish
Timeframe : Daily
No result was found by the Central Candlesticks scanner on Japanese candlesticks.
| S3 | S2 | S1 | Price | R1 | R2 | |
|---|---|---|---|---|---|---|
| ProTrendLines | 6,475 | 6,795 | 6,951 | 7,062 | 7,220 | 7,755 |
| Change (%) | -8.31% | -3.78% | -1.57% | - | +2.24% | +9.81% |
| Change | -587 | -267 | -111 | - | +158 | +693 |
| Level | Major | Major | Intermediate | - | Major | Major |
Pivot points can also be used to set your price objectives. Here is the price situation in relation to pivot points:
| Pivot points | S3 | S2 | S1 | PP | R1 | R2 | R3 |
|---|---|---|---|---|---|---|---|
| Standard | 6,631 | 6,747 | 6,823 | 6,939 | 7,015 | 7,131 | 7,207 |
| Camarilla | 6,847 | 6,865 | 6,882 | 6,900 | 6,918 | 6,935 | 6,953 |
| Woodie | 6,612 | 6,737 | 6,804 | 6,929 | 6,996 | 7,121 | 7,188 |
| Fibonacci | 6,747 | 6,820 | 6,865 | 6,939 | 7,012 | 7,057 | 7,131 |
| Pivot points | S3 | S2 | S1 | PP | R1 | R2 | R3 |
|---|---|---|---|---|---|---|---|
| Standard | 6,689 | 6,815 | 6,895 | 7,021 | 7,101 | 7,227 | 7,307 |
| Camarilla | 6,917 | 6,936 | 6,955 | 6,974 | 6,993 | 7,012 | 7,031 |
| Woodie | 6,665 | 6,804 | 6,871 | 7,010 | 7,077 | 7,216 | 7,283 |
| Fibonacci | 6,815 | 6,894 | 6,943 | 7,021 | 7,100 | 7,149 | 7,227 |
| Pivot points | S3 | S2 | S1 | PP | R1 | R2 | R3 |
|---|---|---|---|---|---|---|---|
| Standard | 5,791 | 6,053 | 6,519 | 6,781 | 7,247 | 7,509 | 7,975 |
| Camarilla | 6,784 | 6,851 | 6,917 | 6,984 | 7,051 | 7,118 | 7,184 |
| Woodie | 5,892 | 6,104 | 6,620 | 6,832 | 7,348 | 7,560 | 8,076 |
| Fibonacci | 6,053 | 6,331 | 6,503 | 6,781 | 7,059 | 7,231 | 7,509 |
Numerical data
The following are the details of the technical indicators and moving averages that were collected to generate this technical analysis:
| RSI (14): | 54.00 | |
| MACD (12,26,9): | 45.0000 | |
| Directional Movement: | -8 | |
| AROON (14): | -57 | |
| DEMA (21): | 7,076 | |
| Parabolic SAR (0,02-0,02-0,2): | 7,193 | |
| Elder Ray (13): | -22 | |
| Super Trend (3,10): | 6,802 | |
| Zig ZAG (10): | 7,066 | |
| VORTEX (21): | 1.0000 | |
| Stochastique (14,3,5): | 43.00 | |
| TEMA (21): | 7,078 | |
| Williams %R (14): | -43.00 | |
| Chande Momentum Oscillator (20): | 116 | |
| Repulse (5,40,3): | 1.0000 | |
| ROCnROLL: | 1 | |
| TRIX (15,9): | 0.0000 | |
| Courbe Coppock: | 1.00 |
| MA7: | 7,028 | |
| MA20: | 7,062 | |
| MA50: | 6,856 | |
| MA100: | 6,870 | |
| MAexp7: | 7,027 | |
| MAexp20: | 7,006 | |
| MAexp50: | 6,926 | |
| MAexp100: | 6,850 | |
| Price / MA7: | +0.48% | |
| Price / MA20: | -0% | |
| Price / MA50: | +3.00% | |
| Price / MA100: | +2.79% | |
| Price / MAexp7: | +0.50% | |
| Price / MAexp20: | +0.80% | |
| Price / MAexp50: | +1.96% | |
| Price / MAexp100: | +3.09% |
About author

Online


Add a comment
Comments
0 comments on the analysis DCC ORD EUR0.25 (CDI) - Daily