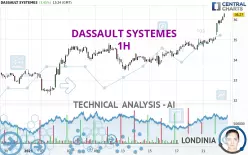
DASSAULT SYSTEMES - 1H - Technical analysis published on 01/22/2025 (GMT)
- 175
- 0
Click here for a new analysis!
- Timeframe : 1H
- - Analysis generated on
- Status : TARGET REACHED

Summary of the analysis

Additional analysis
Quotes
DASSAULT SYSTEMES rating 36.27 EUR. The price registered an increase of +3.45% on the session and was traded between 35.23 EUR and 36.33 EUR over the period. The price is currently at +2.95% from its lowest and -0.17% from its highest.A bullish gap was detected at the opening by the Central Gaps scanner. There are a lot of buyers and they have the upper hand in the very short term.
Opening Gap UP
Type : Bullish
Timeframe : Openning
So that you have an overall view of the price change, here is a table showing the variations over several periods:
New HIGH record (1st january)
Type : Bullish
Timeframe : Weekly
New HIGH record (1 month)
Type : Bullish
Timeframe : Weekly
Technical
A technical analysis in 1H of this DASSAULT SYSTEMES chart shows a strongly bullish trend. The signals given by the moving averages are 92.86% bullish. This strong bullish trend is confirmed by the strong signals currently being given by short-term moving averages. There is no crossing of moving average by the price or crossing of moving averages between themselves.
In fact, according to the parameters integrated into the Central Analyzer system, 16 technical indicators out of 18 analysed are currently bullish. Caution: the Central Indicators scanner currently detects an excess:
RSI indicator is overbought : over 80
Type : Neutral
Timeframe : 1 hour
CCI indicator is overbought : over 100
Type : Neutral
Timeframe : 1 hour
Williams %R indicator is overbought : over -20
Type : Neutral
Timeframe : 1 hour
Pivot points : price is over resistance 2
Type : Neutral
Timeframe : Weekly
Pivot points : price is over resistance 3
Type : Neutral
Timeframe : 1 hour
The Central Patterns scanner, which studies chart patterns, resistances and supports, has identified these signals:
Near horizontal resistance
Type : Bearish
Timeframe : 1 hour
Resistance of channel is broken
Type : Bullish
Timeframe : 1 hour
There is also a Japanese candlestick pattern detected by Central Candlesticks that could mark the end of the current short-term trend:
Doji
Type : Neutral
Timeframe : 1 hour
| S3 | S2 | S1 | Price | R1 | R2 | R3 | |
|---|---|---|---|---|---|---|---|
| ProTrendLines | 34.53 | 35.05 | 35.30 | 36.27 | 36.63 | 37.96 | 39.60 |
| Change (%) | -4.80% | -3.36% | -2.67% | - | +0.99% | +4.66% | +9.18% |
| Change | -1.74 | -1.22 | -0.97 | - | +0.36 | +1.69 | +3.33 |
| Level | Intermediate | Minor | Intermediate | - | Intermediate | Minor | Intermediate |
Pivot points can also be used to set your price objectives. Here is the price situation in relation to pivot points:
| Pivot points | S3 | S2 | S1 | PP | R1 | R2 | R3 |
|---|---|---|---|---|---|---|---|
| Standard | 34.22 | 34.43 | 34.74 | 34.95 | 35.26 | 35.47 | 35.78 |
| Camarilla | 34.92 | 34.97 | 35.01 | 35.06 | 35.11 | 35.16 | 35.20 |
| Woodie | 34.28 | 34.46 | 34.80 | 34.98 | 35.32 | 35.50 | 35.84 |
| Fibonacci | 34.43 | 34.63 | 34.75 | 34.95 | 35.15 | 35.27 | 35.47 |
| Pivot points | S3 | S2 | S1 | PP | R1 | R2 | R3 |
|---|---|---|---|---|---|---|---|
| Standard | 32.32 | 32.89 | 33.80 | 34.37 | 35.28 | 35.85 | 36.76 |
| Camarilla | 34.29 | 34.43 | 34.56 | 34.70 | 34.84 | 34.97 | 35.11 |
| Woodie | 32.48 | 32.98 | 33.96 | 34.46 | 35.44 | 35.94 | 36.92 |
| Fibonacci | 32.89 | 33.46 | 33.81 | 34.37 | 34.94 | 35.29 | 35.85 |
| Pivot points | S3 | S2 | S1 | PP | R1 | R2 | R3 |
|---|---|---|---|---|---|---|---|
| Standard | 28.26 | 30.05 | 31.77 | 33.56 | 35.28 | 37.07 | 38.79 |
| Camarilla | 32.54 | 32.86 | 33.18 | 33.50 | 33.82 | 34.14 | 34.47 |
| Woodie | 28.24 | 30.03 | 31.75 | 33.54 | 35.26 | 37.05 | 38.77 |
| Fibonacci | 30.05 | 31.39 | 32.22 | 33.56 | 34.90 | 35.73 | 37.07 |
Numerical data
The following is the status of the technical indicators and moving averages at the time of publication of this technical analysis:
| RSI (14): | 80.10 | |
| MACD (12,26,9): | 0.3900 | |
| Directional Movement: | 31.72 | |
| AROON (14): | 100.00 | |
| DEMA (21): | 35.83 | |
| Parabolic SAR (0,02-0,02-0,2): | 35.35 | |
| Elder Ray (13): | 0.58 | |
| Super Trend (3,10): | 35.54 | |
| Zig ZAG (10): | 36.20 | |
| VORTEX (21): | 1.3000 | |
| Stochastique (14,3,5): | 98.15 | |
| TEMA (21): | 36.05 | |
| Williams %R (14): | 0.00 | |
| Chande Momentum Oscillator (20): | 1.42 | |
| Repulse (5,40,3): | 1.1900 | |
| ROCnROLL: | 1 | |
| TRIX (15,9): | 0.1200 | |
| Courbe Coppock: | 5.95 |
| MA7: | 34.73 | |
| MA20: | 34.01 | |
| MA50: | 33.51 | |
| MA100: | 33.80 | |
| MAexp7: | 35.88 | |
| MAexp20: | 35.36 | |
| MAexp50: | 34.88 | |
| MAexp100: | 34.54 | |
| Price / MA7: | +4.43% | |
| Price / MA20: | +6.65% | |
| Price / MA50: | +8.24% | |
| Price / MA100: | +7.31% | |
| Price / MAexp7: | +1.09% | |
| Price / MAexp20: | +2.57% | |
| Price / MAexp50: | +3.99% | |
| Price / MAexp100: | +5.01% |
News
The last news published on DASSAULT SYSTEMES at the time of the generation of this analysis was as follows:
- Medidata’s Patient Experience Recognized as Sustainability Solution by the European Union, Paving the Way for Greener Clinical Trials
- Medidata Expands Leadership Team to Drive Patient-Centered and Customer-Focused Innovation
- ClinChoice Extends 13-Year Medidata Partnership with the Addition of Clinical Data Studio to Improve Data Management and Strengthen Clinical Trial Capabilities
- Electrical Grid Operator Red Eléctrica Transforms Its Design Process and Collaboration with Dassault Systèmes’ 3DEXPERIENCE Platform
- Dassault Systèmes and UniLaSalle Combine Learning and Exploring with Virtual Worlds in New 3DEXPERIENCE Edu Center of Excellence
About author
Online


Add a comment
Comments
0 comments on the analysis DASSAULT SYSTEMES - 1H