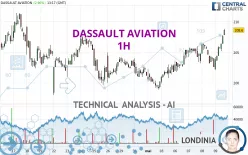
DASSAULT AVIATION - 1H - Technical analysis published on 05/09/2024 (GMT)
- 176
- 0
Click here for a new analysis!
- Timeframe : 1H
- - Analysis generated on
- Status : LEVEL MAINTAINED

Summary of the analysis

Additional analysis
Quotes
The DASSAULT AVIATION rating is 208.0 EUR. The price registered an increase of +2.67% on the session with the lowest point at 202.2 EUR and the highest point at 208.0 EUR. The deviation from the price is +2.87% for the low point and 0% for the high point.The Central Gaps scanner detects a bearish gap which is a sign that the sellers have taken the lead in the very short term.
Opening Gap DOWN
Type : Bearish
Timeframe : Openning
So that you have an overall view of the price change, here is a table showing the variations over several periods:
Near a new HIGH record (5 years)
Type : Bullish
Timeframe : Weekly
Near a new HIGH record (1 year)
Type : Bullish
Timeframe : Weekly
Near a new HIGH record (1st january)
Type : Bullish
Timeframe : Weekly
Near a new LOW record (1 month)
Type : Bearish
Timeframe : Weekly
Technical
Technical analysis of DASSAULT AVIATION in 1H shows a strongly overall bullish trend. 92.86% of the signals given by moving averages are bullish. This strongly bullish trend is supported by the strong bullish signals given by short-term moving averages. The Central Indicators market scanner currently does not detect any result that concerns moving averages.
An assessment of technical indicators shows a strong bullish signal.
Caution: the Central Indicators scanner currently detects an excess:
CCI indicator is overbought : over 100
Type : Neutral
Timeframe : 1 hour
Williams %R indicator is overbought : over -20
Type : Neutral
Timeframe : 1 hour
Pivot points : price is over resistance 2
Type : Neutral
Timeframe : 1 hour
Pivot points : price is over resistance 2
Type : Neutral
Timeframe : Weekly
Central Patterns, the market scanner focusing on chart patterns, resistances and supports found this result:
Near resistance of channel
Type : Bearish
Timeframe : 1 hour
Central Candlesticks, the scanner specialised in Japanese candlesticks, detects a bearish signal that could support the hypothesis of a small drop in the very short term:
Bearish doji star
Type : Bearish
Timeframe : 1 hour
| S3 | S2 | S1 | Price | R1 | R2 | |
|---|---|---|---|---|---|---|
| ProTrendLines | 200.8 | 203.1 | 207.6 | 208.0 | 210.0 | 211.5 |
| Change (%) | -3.46% | -2.36% | -0.19% | - | +0.96% | +1.68% |
| Change | -7.2 | -4.9 | -0.4 | - | +2.0 | +3.5 |
| Level | Intermediate | Minor | Intermediate | - | Major | Major |
To determine price objectives, it is also possible to use the pivot points. Here is the price position in relation to pivot points:
| Pivot points | S3 | S2 | S1 | PP | R1 | R2 | R3 |
|---|---|---|---|---|---|---|---|
| Standard | 197.5 | 200.1 | 201.3 | 203.9 | 205.1 | 207.7 | 208.9 |
| Camarilla | 201.6 | 201.9 | 202.3 | 202.6 | 203.0 | 203.3 | 203.7 |
| Woodie | 196.9 | 199.8 | 200.7 | 203.6 | 204.5 | 207.4 | 208.3 |
| Fibonacci | 200.1 | 201.5 | 202.4 | 203.9 | 205.3 | 206.2 | 207.7 |
| Pivot points | S3 | S2 | S1 | PP | R1 | R2 | R3 |
|---|---|---|---|---|---|---|---|
| Standard | 193.8 | 196.3 | 199.1 | 201.6 | 204.4 | 206.9 | 209.7 |
| Camarilla | 200.3 | 200.8 | 201.3 | 201.8 | 202.3 | 202.8 | 203.3 |
| Woodie | 193.9 | 196.4 | 199.2 | 201.7 | 204.5 | 207.0 | 209.8 |
| Fibonacci | 196.3 | 198.4 | 199.6 | 201.6 | 203.7 | 204.9 | 206.9 |
| Pivot points | S3 | S2 | S1 | PP | R1 | R2 | R3 |
|---|---|---|---|---|---|---|---|
| Standard | 181.3 | 189.5 | 195.3 | 203.5 | 209.3 | 217.5 | 223.3 |
| Camarilla | 197.4 | 198.6 | 199.9 | 201.2 | 202.5 | 203.8 | 205.1 |
| Woodie | 180.2 | 188.9 | 194.2 | 202.9 | 208.2 | 216.9 | 222.2 |
| Fibonacci | 189.5 | 194.8 | 198.1 | 203.5 | 208.8 | 212.1 | 217.5 |
Numerical data
The following are the details of the technical indicators and moving averages that were collected to generate this technical analysis:
| RSI (14): | 65.70 | |
| MACD (12,26,9): | 0.8000 | |
| Directional Movement: | 12.0 | |
| AROON (14): | 42.9 | |
| DEMA (21): | 206.2 | |
| Parabolic SAR (0,02-0,02-0,2): | 202.8 | |
| Elder Ray (13): | 2.2 | |
| Super Trend (3,10): | 204.7 | |
| Zig ZAG (10): | 208.0 | |
| VORTEX (21): | 1.0000 | |
| Stochastique (14,3,5): | 98.80 | |
| TEMA (21): | 206.5 | |
| Williams %R (14): | 0.00 | |
| Chande Momentum Oscillator (20): | 2.4 | |
| Repulse (5,40,3): | 1.2000 | |
| ROCnROLL: | 1 | |
| TRIX (15,9): | 0.0000 | |
| Courbe Coppock: | 0.80 |
| MA7: | 203.2 | |
| MA20: | 204.1 | |
| MA50: | 196.4 | |
| MA100: | 187.3 | |
| MAexp7: | 206.4 | |
| MAexp20: | 205.3 | |
| MAexp50: | 204.3 | |
| MAexp100: | 203.9 | |
| Price / MA7: | +2.36% | |
| Price / MA20: | +1.91% | |
| Price / MA50: | +5.91% | |
| Price / MA100: | +11.05% | |
| Price / MAexp7: | +0.78% | |
| Price / MAexp20: | +1.32% | |
| Price / MAexp50: | +1.81% | |
| Price / MAexp100: | +2.01% |
News
The last news published on DASSAULT AVIATION at the time of the generation of this analysis was as follows:
- Dassault Aviation plant in Bordeaux-Mérignac: inauguration of the new building dedicated to design and operations
- Dassault Aviation: Total number of shares and voting rights - 31 08 21
- Dassault Aviation: Availability of the 2021 first half-year Financial Report as of 30 June 2021
- DASSAULT AVIATION delivers its first Rafale to Greece
- Aquila Data Enabler, in partnership with the Quartz laboratory (ISAE-Supméca), wins the “AI for Industry 2021” challenge co-organized by the Paris Region and Dassault Aviation
About author
Online


Add a comment
Comments
0 comments on the analysis DASSAULT AVIATION - 1H