DARDEN RESTAURANTS INC. - Daily - Technical analysis published on 09/25/2019 (GMT)
- 266
- 0
- Who voted?
Click here for a new analysis!
- Timeframe : Daily
- - Analysis generated on
- Status : TARGET REACHED
Summary of the analysis

Additional analysis
Quotes
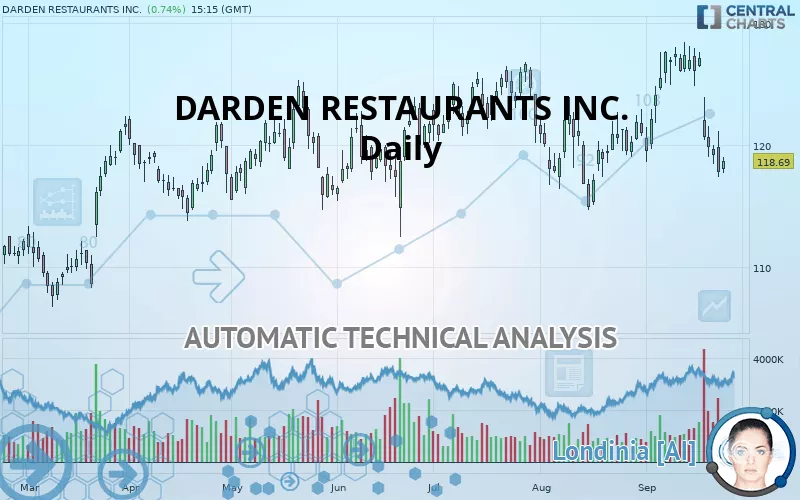
The DARDEN RESTAURANTS INC. price is 118.69 USD. The price has increased by +0.74% since the last closing and was between 117.71 USD and 118.97 USD. This implies that the price is at +0.83% from its lowest and at -0.24% from its highest.The Central Gaps scanner detects a bullish opening. A small advantage for buyers in the very short term.
Bullish opening
Type : Bullish
Timeframe : Openning
Here is a more detailed summary of the historical variations registered by DARDEN RESTAURANTS INC.:
Near a new LOW record (1 month)
Type : Bearish
Timeframe : Weekly
Technical
A technical analysis in Daily of this DARDEN RESTAURANTS INC. chart shows a slightly bearish trend. Only 60.71% of the signals given by moving averages are bearish. This slightly bearish trend is reinforced by the strong signals currently being given by short-term moving averages. There is no crossing of moving average by the price or crossing of moving averages between themselves.
In fact, 12 technical indicators on 18 studied are currently positioned bearish. But beware of excesses. The Central Indicators scanner currently detects this:
CCI indicator is oversold : under -100
Type : Neutral
Timeframe : Daily
Williams %R indicator is oversold : under -80
Type : Neutral
Timeframe : Daily
MACD indicator is back under 0
Type : Bearish
Timeframe : Daily
Price is back under the pivot point
Type : Bearish
Timeframe : Daily
Price is back under the pivot point
Type : Bearish
Timeframe : Weekly
An analysis of the price chart with the Central Patterns scanner (detector of chart patterns and resistances and supports) shows several results that can have an impact on the price change:
Near horizontal support
Type : Bullish
Timeframe : Daily
Support of channel is broken
Type : Bearish
Timeframe : Daily
The Central Candlesticks scanner which studies Japanese candlesticks did not detect anything.
| S3 | S2 | S1 | Price | R1 | R2 | |
|---|---|---|---|---|---|---|
| ProTrendLines | 104.93 | 108.90 | 114.91 | 118.69 | 119.38 | 126.62 |
| Change (%) | -11.59% | -8.25% | -3.18% | - | +0.58% | +6.68% |
| Change | -13.76 | -9.79 | -3.78 | - | +0.69 | +7.93 |
| Level | Minor | Intermediate | Major | - | Major | Major |
Attention could also be paid to pivot points to set price objectives:
| Pivot points | S3 | S2 | S1 | PP | R1 | R2 | R3 |
|---|---|---|---|---|---|---|---|
| Standard | 112.67 | 115.03 | 116.42 | 118.78 | 120.17 | 122.53 | 123.92 |
| Camarilla | 116.79 | 117.13 | 117.48 | 117.82 | 118.16 | 118.51 | 118.85 |
| Woodie | 112.20 | 114.79 | 115.95 | 118.54 | 119.70 | 122.29 | 123.45 |
| Fibonacci | 115.03 | 116.46 | 117.34 | 118.78 | 120.21 | 121.09 | 122.53 |
| Pivot points | S3 | S2 | S1 | PP | R1 | R2 | R3 |
|---|---|---|---|---|---|---|---|
| Standard | 107.52 | 113.29 | 116.54 | 122.31 | 125.56 | 131.33 | 134.58 |
| Camarilla | 117.32 | 118.15 | 118.97 | 119.80 | 120.63 | 121.45 | 122.28 |
| Woodie | 106.27 | 112.66 | 115.29 | 121.68 | 124.31 | 130.70 | 133.33 |
| Fibonacci | 113.29 | 116.73 | 118.86 | 122.31 | 125.75 | 127.88 | 131.33 |
| Pivot points | S3 | S2 | S1 | PP | R1 | R2 | R3 |
|---|---|---|---|---|---|---|---|
| Standard | 106.53 | 110.59 | 115.78 | 119.84 | 125.03 | 129.09 | 134.28 |
| Camarilla | 118.44 | 119.28 | 120.13 | 120.98 | 121.83 | 122.68 | 123.52 |
| Woodie | 107.11 | 110.87 | 116.36 | 120.12 | 125.61 | 129.37 | 134.86 |
| Fibonacci | 110.59 | 114.12 | 116.30 | 119.84 | 123.37 | 125.55 | 129.09 |
Numerical data
The following are the details of the technical indicators and moving averages that were collected to generate this technical analysis:
| RSI (14): | 39.83 | |
| MACD (12,26,9): | -0.4700 | |
| Directional Movement: | -8.98 | |
| AROON (14): | -50.00 | |
| DEMA (21): | 122.10 | |
| Parabolic SAR (0,02-0,02-0,2): | 126.52 | |
| Elder Ray (13): | -3.61 | |
| Super Trend (3,10): | 126.24 | |
| Zig ZAG (10): | 118.65 | |
| VORTEX (21): | 0.9700 | |
| Stochastique (14,3,5): | 7.68 | |
| TEMA (21): | 121.20 | |
| Williams %R (14): | -87.94 | |
| Chande Momentum Oscillator (20): | -8.86 | |
| Repulse (5,40,3): | -2.3500 | |
| ROCnROLL: | 2 | |
| TRIX (15,9): | 0.0800 | |
| Courbe Coppock: | 2.52 |
| MA7: | 121.32 | |
| MA20: | 123.27 | |
| MA50: | 122.09 | |
| MA100: | 120.90 | |
| MAexp7: | 120.68 | |
| MAexp20: | 122.27 | |
| MAexp50: | 121.87 | |
| MAexp100: | 120.27 | |
| Price / MA7: | -2.17% | |
| Price / MA20: | -3.72% | |
| Price / MA50: | -2.78% | |
| Price / MA100: | -1.83% | |
| Price / MAexp7: | -1.65% | |
| Price / MAexp20: | -2.93% | |
| Price / MAexp50: | -2.61% | |
| Price / MAexp100: | -1.31% |
News
The last news published on DARDEN RESTAURANTS INC. at the time of the generation of this analysis was as follows:
- Darden Restaurants Reports Fiscal 2020 First Quarter Results; Declares Regular Quarterly Dividend; Authorizes New $500 Million Share Repurchase Program; And Reaffirms Financial Outlook For The Full Fiscal Year
- Darden Restaurants To Host Fiscal 2020 First Quarter Conference Call On September 19
- Darden Restaurants Reports Fiscal 2019 Fourth Quarter and Full Year Results; Increases Quarterly Dividend 17% to $0.88; And Provides Fiscal 2020 Outlook
- Darden Restaurants To Host fiscal 2019 Fourth Quarter Conference Call On June 20
- Darden Restaurants Announces Animal Welfare Policy Founded On Improvements In Welfare Outcomes
About author

Online


Add a comment
Comments
0 comments on the analysis DARDEN RESTAURANTS INC. - Daily