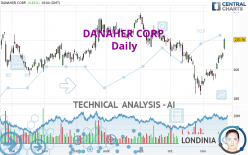
DANAHER CORP. - Daily - Technical analysis published on 11/21/2023 (GMT)
- 153
- 0
Click here for a new analysis!
- Timeframe : Daily
- - Analysis generated on
- Status : TARGET REACHED

Summary of the analysis

Additional analysis
Quotes
The DANAHER CORP. rating is 220.76 USD. On the day, this instrument gained +4.61% and was traded between 213.61 USD and 221.57 USD over the period. The price is currently at +3.35% from its lowest and -0.37% from its highest.The Central Gaps scanner detects the formation of a bullish gap marking the strong presence of buyers against sellers at the opening. This formed a quotation gap.
Opening Gap UP
Type : Bullish
Timeframe : Openning
A study of price movements over other periods shows the following variations:
New HIGH record (1 month)
Type : Bullish
Timeframe : Weekly
Technical
A technical analysis in Daily of this DANAHER CORP. chart shows a bullish trend. The signals returned by the moving averages are 71.43% bullish. This bullish trend is reinforced by the strong signals currently being given by short-term moving averages. An assessment of moving averages reveals several bullish signals that could impact this trend:
Bullish price crossover with Moving Average 100
Type : Bullish
Timeframe : Daily
Bullish price crossover with adaptative moving average 100
Type : Bullish
Timeframe : Daily
The probability of a further increase is high given the direction of the technical indicators.
But beware of excesses. The Central Indicators scanner currently detects this:
CCI indicator is overbought : over 100
Type : Neutral
Timeframe : Daily
Williams %R indicator is overbought : over -20
Type : Neutral
Timeframe : Daily
Pivot points : price is over resistance 2
Type : Neutral
Timeframe : Weekly
Pivot points : price is over resistance 3
Type : Neutral
Timeframe : Daily
Central Patterns, the market scanner focusing on chart patterns, resistances and supports found these results:
Near horizontal resistance
Type : Bearish
Timeframe : Daily
Resistance of channel is broken
Type : Bullish
Timeframe : Daily
For a small rebound in the very short term, the Central Candlesticks scanner currently notes the presence of this bullish pattern in Japanese candlesticks:
Upside gap
Type : Bullish
Timeframe : Daily
| S3 | S2 | S1 | Price | R1 | R2 | R3 | |
|---|---|---|---|---|---|---|---|
| ProTrendLines | 199.23 | 209.12 | 220.24 | 220.76 | 226.71 | 235.30 | 266.93 |
| Change (%) | -9.75% | -5.27% | -0.24% | - | +2.70% | +6.59% | +20.91% |
| Change | -21.53 | -11.64 | -0.52 | - | +5.95 | +14.54 | +46.17 |
| Level | Intermediate | Major | Intermediate | - | Intermediate | Intermediate | Intermediate |
Pivot points can also be used to set your price objectives. Here is the price situation in relation to pivot points:
| Pivot points | S3 | S2 | S1 | PP | R1 | R2 | R3 |
|---|---|---|---|---|---|---|---|
| Standard | 204.34 | 205.98 | 208.51 | 210.15 | 212.68 | 214.32 | 216.85 |
| Camarilla | 209.88 | 210.27 | 210.65 | 211.03 | 211.41 | 211.80 | 212.18 |
| Woodie | 204.78 | 206.20 | 208.95 | 210.37 | 213.12 | 214.54 | 217.29 |
| Fibonacci | 205.98 | 207.58 | 208.56 | 210.15 | 211.75 | 212.73 | 214.32 |
| Pivot points | S3 | S2 | S1 | PP | R1 | R2 | R3 |
|---|---|---|---|---|---|---|---|
| Standard | 181.41 | 187.58 | 197.68 | 203.85 | 213.95 | 220.12 | 230.22 |
| Camarilla | 203.31 | 204.80 | 206.29 | 207.78 | 209.27 | 210.76 | 212.25 |
| Woodie | 183.38 | 188.56 | 199.65 | 204.83 | 215.92 | 221.10 | 232.19 |
| Fibonacci | 187.58 | 193.80 | 197.64 | 203.85 | 210.07 | 213.91 | 220.12 |
| Pivot points | S3 | S2 | S1 | PP | R1 | R2 | R3 |
|---|---|---|---|---|---|---|---|
| Standard | 135.95 | 159.02 | 175.52 | 198.59 | 215.09 | 238.16 | 254.66 |
| Camarilla | 181.14 | 184.77 | 188.39 | 192.02 | 195.65 | 199.28 | 202.90 |
| Woodie | 132.67 | 157.38 | 172.24 | 196.95 | 211.81 | 236.52 | 251.38 |
| Fibonacci | 159.02 | 174.14 | 183.47 | 198.59 | 213.71 | 223.04 | 238.16 |
Numerical data
The following is the status of technical indicators and moving averages registered at the time this technical analysis was created:
| RSI (14): | 68.85 | |
| MACD (12,26,9): | 1.4600 | |
| Directional Movement: | 17.56 | |
| AROON (14): | 100.00 | |
| DEMA (21): | 204.30 | |
| Parabolic SAR (0,02-0,02-0,2): | 195.75 | |
| Elder Ray (13): | 12.08 | |
| Super Trend (3,10): | 200.85 | |
| Zig ZAG (10): | 220.97 | |
| VORTEX (21): | 0.9300 | |
| Stochastique (14,3,5): | 94.79 | |
| TEMA (21): | 209.62 | |
| Williams %R (14): | -1.80 | |
| Chande Momentum Oscillator (20): | 23.12 | |
| Repulse (5,40,3): | 5.2800 | |
| ROCnROLL: | 1 | |
| TRIX (15,9): | -0.1600 | |
| Courbe Coppock: | 16.78 |
| MA7: | 208.07 | |
| MA20: | 198.59 | |
| MA50: | 209.19 | |
| MA100: | 216.16 | |
| MAexp7: | 209.47 | |
| MAexp20: | 204.25 | |
| MAexp50: | 207.75 | |
| MAexp100: | 212.25 | |
| Price / MA7: | +6.10% | |
| Price / MA20: | +11.16% | |
| Price / MA50: | +5.53% | |
| Price / MA100: | +2.13% | |
| Price / MAexp7: | +5.39% | |
| Price / MAexp20: | +8.08% | |
| Price / MAexp50: | +6.26% | |
| Price / MAexp100: | +4.01% |
News
The latest news and videos published on DANAHER CORP. at the time of the analysis were as follows:
- DEADLINE ACTION ALERT: The Schall Law Firm Encourages Investors in Danaher Corporation with Losses of $100,000 to Contact the Firm
- SHAREHOLDER ACTION NOTICE: The Schall Law Firm Encourages Investors in Danaher Corporation with Losses of $100,000 to Contact the Firm
- SHAREHOLDER ACTION ALERT: The Schall Law Firm Encourages Investors in Danaher Corporation with Losses of $100,000 to Contact the Firm
- SHAREHOLDER ACTION NOTICE: The Schall Law Firm Announces it is Investigating Claims Against Danaher Corporation and Encourages Investors with Losses to Contact the Firm
- INVESTOR ACTION NOTICE: The Schall Law Firm Announces it is Investigating Claims Against Danaher Corporation and Encourages Investors with Losses to Contact the Firm
About author
Online


Add a comment
Comments
0 comments on the analysis DANAHER CORP. - Daily