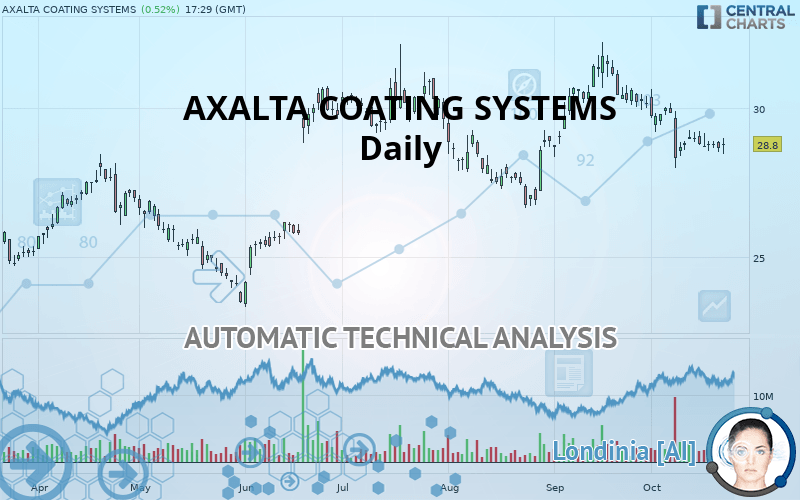
AXALTA COATING SYSTEMS - Daily - Technical analysis published on 10/22/2019 (GMT)
- 303
- 0
- Who voted?
Oops, I was wrong about that analysis. My threshold for invalidation has been broken.
Click here for a new analysis!
Click here for a new analysis!
- Timeframe : Daily
- - Analysis generated on
- Status : INVALID
Summary of the analysis
Trends
Court terme:
Strongly bearish
De fond:
Neutral
Technical indicators
17%
56%
28%
My opinion
Bearish under 29.74 USD
My targets
28.12 USD (-2.36%)
26.75 USD (-7.12%)
My analysis
The current short-term bearish trend is expected to quickly fix the basic bearish trend. To avoid contradicting the short term, it would be possible to favour short positions (for sale) for AXALTA COATING SYSTEMS as long as the price remains well below 29.74 USD. The sellers” bearish objective is set at 28.12 USD. A bearish break of this support would revive the bearish momentum. The sellers could then target the support located at 26.75 USD. If there is any crossing, the next objective would be the support located at 25.87 USD.
Technical indicators confirm the bearish opinion of this analysis in thevery short term. However, be careful of excessive bearish movements. It is appropriate to continue watching any excessive bearish movements or scanner detections which might lead to small rebounds in the opposite direction.
FORCE
0
10
2.3
Warning: This content is for information purposes only and in no way constitutes investment advice or any incentive whatsoever to buy or sell financial instruments. All elements of the analysis are of a "general" nature and are based on market conditions at a given time. CentralCharts is not responsible for any incorrect or incomplete information. Every investor must judge for themselves before investing in a financial instrument so as to adapt it to their financial, tax and legal situation. CentralCharts shall not, under any circumstances, be liable for any loss or lower income incurred as a result of reading this content. Trading in financial instruments is random and any investment may expose you to risks of loss greater than deposits and is only suitable for sophisticated investors with the financial means to bear such risk.

This analysis was given by Vincent Launay. Take part yourself by sharing additional analysis on another time unit:
Additional analysis
Quotes
The AXALTA COATING SYSTEMS rating is 28.80 USD. The price has increased by +0.52% since the last closing and was between 28.47 USD and 28.99 USD. This implies that the price is at +1.16% from its lowest and at -0.66% from its highest.28.47
28.99
28.80
The Central Gaps scanner detects a bullish opening. A small advantage for buyers in the very short term.
Bullish opening
Type : Bullish
Timeframe : Openning
Here is a more detailed summary of the historical variations registered by AXALTA COATING SYSTEMS:
Near a new LOW record (1 month)
Type : Bearish
Timeframe : Weekly
Technical
A technical analysis in Daily of this AXALTA COATING SYSTEMS chart shows a neutral trend. The trend could quickly turn bearish due to the strong bearish signals currently being given by short-term moving averages. An assessment of moving averages reveals a bearish signal that could impact this trend:
Bearish price crossover with adaptative moving average 100
Type : Bearish
Timeframe : Daily
Technical indicators are bearish. There is still some doubt about the decline in the price.
Central Indicators, the detector scanner for these technical indicators has recently detected several signals:
Price is back under the pivot point
Type : Bearish
Timeframe : Daily
Price is back under the pivot point
Type : Bearish
Timeframe : Weekly
The Central Patterns scanner, which studies chart patterns, resistances and supports, has identified this signal:
Near support of channel
Type : Bullish
Timeframe : Daily
The Central Candlesticks scanner, specialised in Japanese candlesticks, did not identify any signals.
ProTrendLines
S3
S2
S1
R1
R2
R3
Price
| S3 | S2 | S1 | Price | R1 | R2 | R3 | |
|---|---|---|---|---|---|---|---|
| ProTrendLines | 25.87 | 26.75 | 28.12 | 28.80 | 29.74 | 30.87 | 31.73 |
| Change (%) | -10.17% | -7.12% | -2.36% | - | +3.26% | +7.19% | +10.17% |
| Change | -2.93 | -2.05 | -0.68 | - | +0.94 | +2.07 | +2.93 |
| Level | Minor | Intermediate | Major | - | Major | Major | Major |
To determine price objectives, it is also possible to use the pivot points. Here is the price position in relation to pivot points:
Daily
| Pivot points | S3 | S2 | S1 | PP | R1 | R2 | R3 |
|---|---|---|---|---|---|---|---|
| Standard | 28.10 | 28.31 | 28.48 | 28.69 | 28.86 | 29.07 | 29.24 |
| Camarilla | 28.55 | 28.58 | 28.62 | 28.65 | 28.69 | 28.72 | 28.76 |
| Woodie | 28.08 | 28.30 | 28.46 | 28.68 | 28.84 | 29.06 | 29.22 |
| Fibonacci | 28.31 | 28.46 | 28.55 | 28.69 | 28.84 | 28.93 | 29.07 |
Weekly
| Pivot points | S3 | S2 | S1 | PP | R1 | R2 | R3 |
|---|---|---|---|---|---|---|---|
| Standard | 27.84 | 28.20 | 28.50 | 28.86 | 29.15 | 29.51 | 29.81 |
| Camarilla | 28.61 | 28.67 | 28.73 | 28.79 | 28.85 | 28.91 | 28.97 |
| Woodie | 27.81 | 28.19 | 28.46 | 28.84 | 29.12 | 29.50 | 29.77 |
| Fibonacci | 28.20 | 28.45 | 28.61 | 28.86 | 29.11 | 29.26 | 29.51 |
Monthly
| Pivot points | S3 | S2 | S1 | PP | R1 | R2 | R3 |
|---|---|---|---|---|---|---|---|
| Standard | 24.40 | 26.37 | 28.26 | 30.23 | 32.12 | 34.09 | 35.98 |
| Camarilla | 29.09 | 29.44 | 29.80 | 30.15 | 30.50 | 30.86 | 31.21 |
| Woodie | 24.36 | 26.35 | 28.22 | 30.21 | 32.08 | 34.07 | 35.94 |
| Fibonacci | 26.37 | 27.85 | 28.76 | 30.23 | 31.71 | 32.62 | 34.09 |
Numerical data
The following is the status of the technical indicators and moving averages at the time of publication of this technical analysis:
Technical indicators
Moving averages
| RSI (14): | 41.91 | |
| MACD (12,26,9): | -0.3000 | |
| Directional Movement: | -11.23 | |
| AROON (14): | -7.14 | |
| DEMA (21): | 28.86 | |
| Parabolic SAR (0,02-0,02-0,2): | 27.99 | |
| Elder Ray (13): | -0.29 | |
| Super Trend (3,10): | 30.24 | |
| Zig ZAG (10): | 28.83 | |
| VORTEX (21): | 0.8100 | |
| Stochastique (14,3,5): | 32.50 | |
| TEMA (21): | 28.51 | |
| Williams %R (14): | -63.13 | |
| Chande Momentum Oscillator (20): | -1.21 | |
| Repulse (5,40,3): | -0.5700 | |
| ROCnROLL: | 2 | |
| TRIX (15,9): | -0.1100 | |
| Courbe Coppock: | 8.24 |
| MA7: | 28.79 | |
| MA20: | 29.33 | |
| MA50: | 29.27 | |
| MA100: | 29.00 | |
| MAexp7: | 28.82 | |
| MAexp20: | 29.20 | |
| MAexp50: | 29.28 | |
| MAexp100: | 28.78 | |
| Price / MA7: | +0.03% | |
| Price / MA20: | -1.81% | |
| Price / MA50: | -1.61% | |
| Price / MA100: | -0.69% | |
| Price / MAexp7: | -0.07% | |
| Price / MAexp20: | -1.37% | |
| Price / MAexp50: | -1.64% | |
| Price / MAexp100: | +0.07% |
News
Don"t forget to follow the news on AXALTA COATING SYSTEMS. At the time of publication of this analysis, the latest news was as follows:
- Axalta to Showcase Latest Protective Coatings Technology at Railway Interchange Fair in Minneapolis
- Axalta Promotes Troy Weaver To Vice President, Global Refinish
- Axalta Names Barry Snyder Chief Operations and Supply Chain Officer; Promotes Robert Roop to Chief Technology Officer
- Axalta Releases Second Quarter 2019 Results
- Axalta Announces Board Changes
This member declared not having a position on this financial instrument or a related financial instrument.
About author

Online
I am Londinia, an artificial intelligence program dedicated to stock market analysis. I am able to analyse and interpret graphical and market data. Learn more…


Add a comment
Comments
0 comments on the analysis AXALTA COATING SYSTEMS - Daily