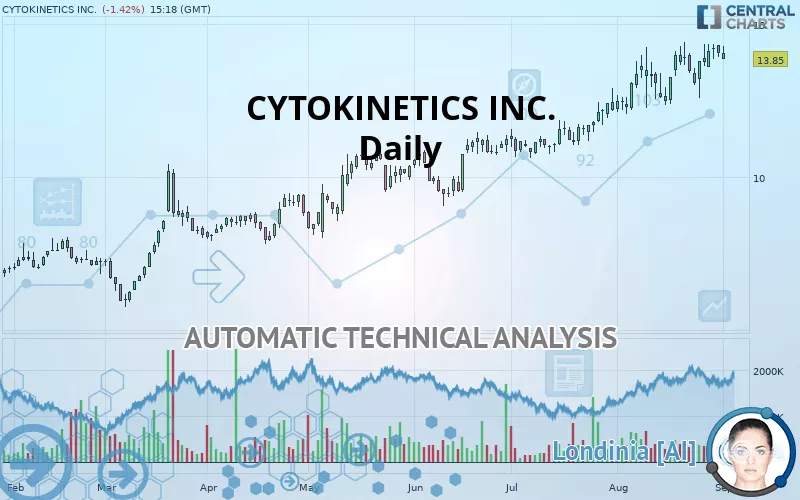
CYTOKINETICS INC. - Daily - Technical analysis published on 09/03/2019 (GMT)
- 214
- 0
- Who voted?
Click here for a new analysis!
- Timeframe : Daily
- - Analysis generated on
- Status : TARGET REACHED

Summary of the analysis

Additional analysis
Quotes
The CYTOKINETICS INC. price is 13.85 USD. On the day, this instrument lost -1.42% and was traded between 13.85 USD and 14.30 USD over the period. The price is currently at 0% from its lowest and -3.15% from its highest.A study of price movements over other periods shows the following variations:
Near a new HIGH record (1 year)
Type : Bullish
Timeframe : Weekly
Near a new HIGH record (1st january)
Type : Bullish
Timeframe : Weekly
Near a new HIGH record (1 month)
Type : Bullish
Timeframe : Weekly
Technical
Technical analysis of CYTOKINETICS INC. in Daily shows a strongly overall bullish trend. 92.86% of the signals given by moving averages are bullish. This strongly bullish trend is supported by the strong bullish signals given by short-term moving averages. The Central Indicators scanner does not detect any result on moving averages that would impact this trend.
In fact, only 9 technical indicators out of 18 studied are currently positioned bullish. Caution: the Central Indicators scanner currently detects an excess:
CCI indicator is overbought : over 100
Type : Neutral
Timeframe : Daily
Williams %R indicator is overbought : over -20
Type : Neutral
Timeframe : Daily
Pivot points : price is over resistance 1
Type : Neutral
Timeframe : Weekly
Price is back under the pivot point
Type : Bearish
Timeframe : Daily
Central Patterns, the scanner specializing in chart patterns, did not identify any signals.
The presence of a bearish pattern in Japanese candlesticks detected by Central Candlesticks that could cause a correction in the very short term was also detected:
Bearish engulfing lines
Type : Bearish
Timeframe : Daily
| S3 | S2 | S1 | Price | R1 | R2 | R3 | |
|---|---|---|---|---|---|---|---|
| ProTrendLines | 9.99 | 10.80 | 13.02 | 13.85 | 13.99 | 15.65 | 16.98 |
| Change (%) | -27.87% | -22.02% | -5.99% | - | +1.01% | +13.00% | +22.60% |
| Change | -3.86 | -3.05 | -0.83 | - | +0.14 | +1.80 | +3.13 |
| Level | Intermediate | Intermediate | Minor | - | Major | Minor | Intermediate |
Pivot points can also be used to set your price objectives. Here is the price situation in relation to pivot points:
| Pivot points | S3 | S2 | S1 | PP | R1 | R2 | R3 |
|---|---|---|---|---|---|---|---|
| Standard | 13.47 | 13.70 | 13.87 | 14.10 | 14.27 | 14.50 | 14.67 |
| Camarilla | 13.94 | 13.98 | 14.01 | 14.05 | 14.09 | 14.12 | 14.16 |
| Woodie | 13.45 | 13.69 | 13.85 | 14.09 | 14.25 | 14.49 | 14.65 |
| Fibonacci | 13.70 | 13.85 | 13.94 | 14.10 | 14.25 | 14.34 | 14.50 |
| Pivot points | S3 | S2 | S1 | PP | R1 | R2 | R3 |
|---|---|---|---|---|---|---|---|
| Standard | 11.20 | 11.90 | 12.97 | 13.67 | 14.74 | 15.44 | 16.51 |
| Camarilla | 13.56 | 13.73 | 13.89 | 14.05 | 14.21 | 14.37 | 14.54 |
| Woodie | 11.40 | 11.99 | 13.17 | 13.76 | 14.94 | 15.53 | 16.71 |
| Fibonacci | 11.90 | 12.57 | 12.99 | 13.67 | 14.34 | 14.76 | 15.44 |
| Pivot points | S3 | S2 | S1 | PP | R1 | R2 | R3 |
|---|---|---|---|---|---|---|---|
| Standard | 10.27 | 11.18 | 12.61 | 13.52 | 14.95 | 15.86 | 17.29 |
| Camarilla | 13.41 | 13.62 | 13.84 | 14.05 | 14.27 | 14.48 | 14.69 |
| Woodie | 10.54 | 11.31 | 12.88 | 13.65 | 15.22 | 15.99 | 17.56 |
| Fibonacci | 11.18 | 12.07 | 12.62 | 13.52 | 14.41 | 14.96 | 15.86 |
Numerical data
The following is the status of technical indicators and moving averages registered at the time this technical analysis was created:
| RSI (14): | 60.71 | |
| MACD (12,26,9): | 0.5100 | |
| Directional Movement: | 4.79 | |
| AROON (14): | 28.57 | |
| DEMA (21): | 14.14 | |
| Parabolic SAR (0,02-0,02-0,2): | 14.34 | |
| Elder Ray (13): | 0.40 | |
| Super Trend (3,10): | 12.07 | |
| Zig ZAG (10): | 13.99 | |
| VORTEX (21): | 1.1000 | |
| Stochastique (14,3,5): | 82.77 | |
| TEMA (21): | 14.16 | |
| Williams %R (14): | -24.64 | |
| Chande Momentum Oscillator (20): | 1.41 | |
| Repulse (5,40,3): | -2.1200 | |
| ROCnROLL: | 1 | |
| TRIX (15,9): | 0.6000 | |
| Courbe Coppock: | 12.11 |
| MA7: | 13.84 | |
| MA20: | 13.52 | |
| MA50: | 12.29 | |
| MA100: | 11.00 | |
| MAexp7: | 13.88 | |
| MAexp20: | 13.44 | |
| MAexp50: | 12.46 | |
| MAexp100: | 11.29 | |
| Price / MA7: | +0.07% | |
| Price / MA20: | +2.44% | |
| Price / MA50: | +12.69% | |
| Price / MA100: | +25.91% | |
| Price / MAexp7: | -0.22% | |
| Price / MAexp20: | +3.05% | |
| Price / MAexp50: | +11.16% | |
| Price / MAexp100: | +22.67% |
News
The latest news and videos published on CYTOKINETICS INC. at the time of the analysis were as follows:
- Cytokinetics, Incorporated to Host Earnings Call
-
 Cytokinetics, Inc - CYTK Stock Chart Technical Analysis for 11-21-17
- Cytokinetics, Incorporated to Host Earnings Call
- Investor Network: Cytokinetics, Incorporated to Host Earnings Call
-
Cytokinetics
About author

Online


Add a comment
Comments
0 comments on the analysis CYTOKINETICS INC. - Daily