COSTAMARE INC. - Daily - Technical analysis published on 03/05/2020 (GMT)
- 366
- 0
- Who voted?
Click here for a new analysis!
- Timeframe : Daily
- - Analysis generated on
- Status : TARGET REACHED
Summary of the analysis

Additional analysis
Quotes
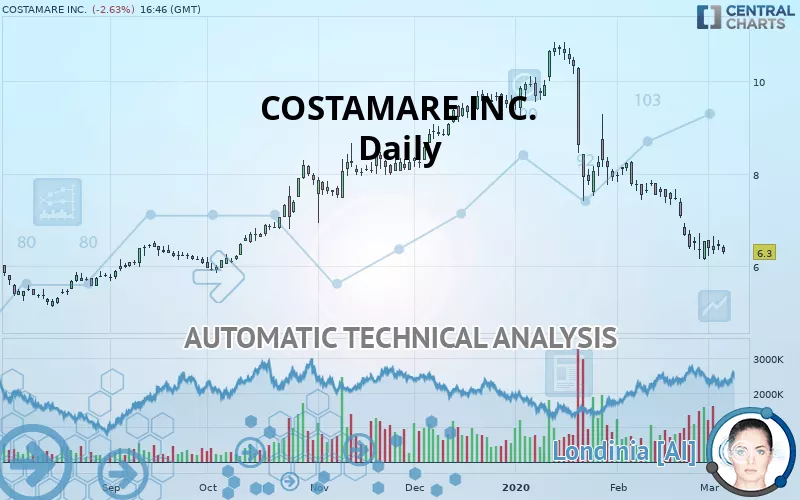
COSTAMARE INC. rating 6.30 USD. The price is lower by -2.63% since the last closing with the lowest point at 6.26 USD and the highest point at 6.46 USD. The deviation from the price is +0.64% for the low point and -2.48% for the high point.A bearish opening was detected by the Central Gaps scanner. Sellers are trying to impose a bearish trend in the very short term.
Bearish opening
Type : Bearish
Timeframe : Openning
Here is a more detailed summary of the historical variations registered by COSTAMARE INC.:
Near a new LOW record (1st january)
Type : Bearish
Timeframe : Weekly
Near a new LOW record (1 month)
Type : Bearish
Timeframe : Weekly
Technical
Technical analysis of this Daily chart of COSTAMARE INC. indicates that the overall trend is strongly bearish. 85.71% of the signals given by moving averages are bearish. This strongly bearish trend is supported by the strong bearish signals given by short-term moving averages. There is no crossing of moving average by the price or crossing of moving averages between themselves.
In fact, 12 technical indicators on 18 studied are currently positioned bearish. But beware of excesses. The Central Indicators scanner currently detects this:
RSI indicator is oversold : under 30
Type : Neutral
Timeframe : Daily
Williams %R indicator is oversold : under -80
Type : Neutral
Timeframe : Daily
Pivot points : price is under support 1
Type : Neutral
Timeframe : Daily
Price is back over the pivot point
Type : Bullish
Timeframe : Daily
Central Patterns, the scanner specializing in chart patterns, did not identify any signals.
The Central Candlesticks scanner which studies Japanese candlesticks did not detect anything.
| S3 | S2 | S1 | Price | R1 | R2 | R3 | |
|---|---|---|---|---|---|---|---|
| ProTrendLines | 4.95 | 5.51 | 6.20 | 6.30 | 6.95 | 7.54 | 8.28 |
| Change (%) | -21.43% | -12.54% | -1.59% | - | +10.32% | +19.68% | +31.43% |
| Change | -1.35 | -0.79 | -0.10 | - | +0.65 | +1.24 | +1.98 |
| Level | Intermediate | Major | Major | - | Minor | Major | Major |
Pivot points can also be used to set your price objectives. Here is the price situation in relation to pivot points:
| Pivot points | S3 | S2 | S1 | PP | R1 | R2 | R3 |
|---|---|---|---|---|---|---|---|
| Standard | 6.14 | 6.24 | 6.36 | 6.46 | 6.58 | 6.68 | 6.80 |
| Camarilla | 6.41 | 6.43 | 6.45 | 6.47 | 6.49 | 6.51 | 6.53 |
| Woodie | 6.14 | 6.25 | 6.36 | 6.47 | 6.58 | 6.69 | 6.80 |
| Fibonacci | 6.24 | 6.33 | 6.38 | 6.46 | 6.55 | 6.60 | 6.68 |
| Pivot points | S3 | S2 | S1 | PP | R1 | R2 | R3 |
|---|---|---|---|---|---|---|---|
| Standard | 5.34 | 5.73 | 6.13 | 6.53 | 6.92 | 7.32 | 7.72 |
| Camarilla | 6.31 | 6.39 | 6.46 | 6.53 | 6.60 | 6.68 | 6.75 |
| Woodie | 5.34 | 5.73 | 6.13 | 6.53 | 6.93 | 7.32 | 7.72 |
| Fibonacci | 5.73 | 6.04 | 6.22 | 6.53 | 6.83 | 7.02 | 7.32 |
| Pivot points | S3 | S2 | S1 | PP | R1 | R2 | R3 |
|---|---|---|---|---|---|---|---|
| Standard | 3.54 | 4.83 | 5.68 | 6.98 | 7.82 | 9.12 | 9.97 |
| Camarilla | 5.94 | 6.14 | 6.33 | 6.53 | 6.73 | 6.92 | 7.12 |
| Woodie | 3.32 | 4.72 | 5.46 | 6.86 | 7.60 | 9.01 | 9.75 |
| Fibonacci | 4.83 | 5.65 | 6.16 | 6.98 | 7.79 | 8.30 | 9.12 |
Numerical data
The following are the details of the technical indicators and moving averages that were collected to generate this technical analysis:
| RSI (14): | 28.71 | |
| MACD (12,26,9): | -0.5700 | |
| Directional Movement: | -22.42 | |
| AROON (14): | -71.43 | |
| DEMA (21): | 6.28 | |
| Parabolic SAR (0,02-0,02-0,2): | 6.68 | |
| Elder Ray (13): | -0.37 | |
| Super Trend (3,10): | 7.41 | |
| Zig ZAG (10): | 6.28 | |
| VORTEX (21): | 0.7400 | |
| Stochastique (14,3,5): | 14.18 | |
| TEMA (21): | 6.07 | |
| Williams %R (14): | -89.63 | |
| Chande Momentum Oscillator (20): | -1.20 | |
| Repulse (5,40,3): | -3.8800 | |
| ROCnROLL: | 2 | |
| TRIX (15,9): | -1.0300 | |
| Courbe Coppock: | 32.54 |
| MA7: | 6.42 | |
| MA20: | 7.06 | |
| MA50: | 8.37 | |
| MA100: | 8.19 | |
| MAexp7: | 6.48 | |
| MAexp20: | 7.03 | |
| MAexp50: | 7.75 | |
| MAexp100: | 7.74 | |
| Price / MA7: | -1.87% | |
| Price / MA20: | -10.76% | |
| Price / MA50: | -24.73% | |
| Price / MA100: | -23.08% | |
| Price / MAexp7: | -2.78% | |
| Price / MAexp20: | -10.38% | |
| Price / MAexp50: | -18.71% | |
| Price / MAexp100: | -18.60% |
News
Don"t forget to follow the news on COSTAMARE INC.. At the time of publication of this analysis, the latest news was as follows:
- Costamare Inc. Announces Availability of Its Annual Report on Form 20-F for the Year Ended December 31, 2019
- Costamare Inc. Reports Results for the Fourth Quarter and Year Ended December 31, 2019
- Costamare Inc. Confirms Date for Its Fourth Quarter 2019 Results Release
- Costamare Inc. Sets the Date for Its Fourth Quarter 2019 Results Release, Conference Call and Webcast
- Costamare Inc. Declares Quarterly Dividend on Its Preferred and Common Stock
About author

Online


Add a comment
Comments
0 comments on the analysis COSTAMARE INC. - Daily