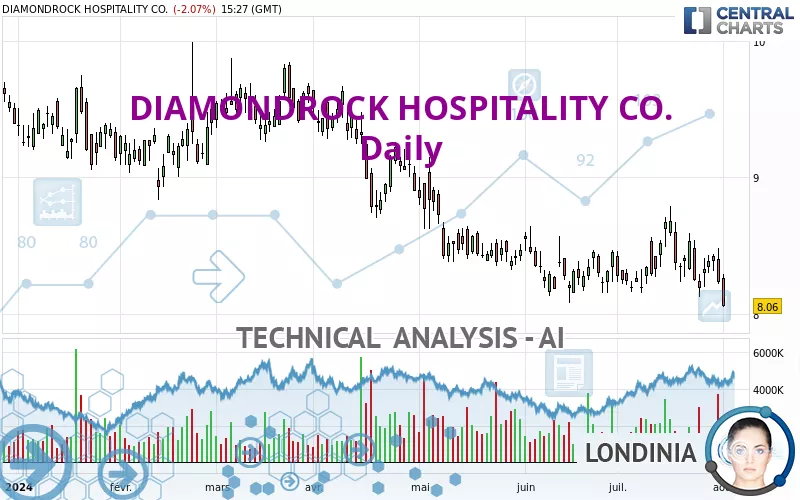
DIAMONDROCK HOSPITALITY CO. - Daily - Technical analysis published on 08/01/2024 (GMT)
- 135
- 0
Click here for a new analysis!
- Timeframe : Daily
- - Analysis generated on
- Status : INVALID

Summary of the analysis

Additional analysis
Quotes
The DIAMONDROCK HOSPITALITY CO. rating is 8.06 USD. On the day, this instrument lost -2.07% with the lowest point at 8.05 USD and the highest point at 8.29 USD. The deviation from the price is +0.12% for the low point and -2.77% for the high point.A bullish opening was detected by the Central Gaps scanner. Buyers are trying to impose a bullish momentum in the very short term.
Bullish opening
Type : Bullish
Timeframe : Openning
Here is a more detailed summary of the historical variations registered by DIAMONDROCK HOSPITALITY CO.:
Near a new LOW record (1st january)
Type : Bearish
Timeframe : Weekly
Near a new HIGH record (1 month)
Type : Bullish
Timeframe : Weekly
Technical
Technical analysis of this Daily chart of DIAMONDROCK HOSPITALITY CO. indicates that the overall trend is strongly bearish. 89.29% of the signals given by moving averages are bearish. This strongly bearish trend is supported by the strong bearish signals given by short-term moving averages. An assessment of moving averages reveals a bearish signal that could impact this trend:
Bearish trend reversal : adaptative moving average 20
Type : Bearish
Timeframe : Daily
The probability of a further decline is moderate given the direction of the technical indicators.
Caution: the Central Indicators scanner currently detects an excess:
CCI indicator is oversold : under -100
Type : Neutral
Timeframe : Daily
Williams %R indicator is oversold : under -80
Type : Neutral
Timeframe : Daily
Pivot points : price is under support 1
Type : Neutral
Timeframe : Daily
SuperTrend indicator bearish reversal
Type : Bearish
Timeframe : Daily
An analysis of the price chart with the Central Patterns scanner (detector of chart patterns and resistances and supports) shows a result that can have an impact on the price change:
Near support of triangle
Type : Bullish
Timeframe : Daily
The presence of a bearish pattern in Japanese candlesticks detected by Central Candlesticks that could cause a correction in the very short term was also detected:
Three black crows
Type : Bearish
Timeframe : Daily
| S3 | S2 | S1 | Price | R1 | R2 | R3 | |
|---|---|---|---|---|---|---|---|
| ProTrendLines | 6.19 | 7.30 | 7.93 | 8.06 | 8.19 | 8.53 | 8.77 |
| Change (%) | -23.20% | -9.43% | -1.61% | - | +1.61% | +5.83% | +8.81% |
| Change | -1.87 | -0.76 | -0.13 | - | +0.13 | +0.47 | +0.71 |
| Level | Intermediate | Major | Major | - | Major | Intermediate | Major |
Attention could also be paid to pivot points to set price objectives:
| Pivot points | S3 | S2 | S1 | PP | R1 | R2 | R3 |
|---|---|---|---|---|---|---|---|
| Standard | 7.88 | 8.05 | 8.14 | 8.31 | 8.40 | 8.57 | 8.66 |
| Camarilla | 8.16 | 8.18 | 8.21 | 8.23 | 8.25 | 8.28 | 8.30 |
| Woodie | 7.84 | 8.03 | 8.10 | 8.29 | 8.36 | 8.55 | 8.62 |
| Fibonacci | 8.05 | 8.15 | 8.21 | 8.31 | 8.41 | 8.47 | 8.57 |
| Pivot points | S3 | S2 | S1 | PP | R1 | R2 | R3 |
|---|---|---|---|---|---|---|---|
| Standard | 7.63 | 7.88 | 8.10 | 8.35 | 8.57 | 8.82 | 9.04 |
| Camarilla | 8.20 | 8.24 | 8.29 | 8.33 | 8.37 | 8.42 | 8.46 |
| Woodie | 7.63 | 7.87 | 8.10 | 8.34 | 8.57 | 8.81 | 9.04 |
| Fibonacci | 7.88 | 8.06 | 8.17 | 8.35 | 8.53 | 8.64 | 8.82 |
| Pivot points | S3 | S2 | S1 | PP | R1 | R2 | R3 |
|---|---|---|---|---|---|---|---|
| Standard | 7.31 | 7.72 | 7.97 | 8.38 | 8.63 | 9.04 | 9.29 |
| Camarilla | 8.05 | 8.11 | 8.17 | 8.23 | 8.29 | 8.35 | 8.41 |
| Woodie | 7.24 | 7.68 | 7.90 | 8.34 | 8.56 | 9.00 | 9.22 |
| Fibonacci | 7.72 | 7.97 | 8.13 | 8.38 | 8.63 | 8.79 | 9.04 |
Numerical data
The following is the status of technical indicators and moving averages registered at the time this technical analysis was created:
| RSI (14): | 40.50 | |
| MACD (12,26,9): | -0.0300 | |
| Directional Movement: | -2.11 | |
| AROON (14): | -78.57 | |
| DEMA (21): | 8.29 | |
| Parabolic SAR (0,02-0,02-0,2): | 8.62 | |
| Elder Ray (13): | -0.13 | |
| Super Trend (3,10): | 8.78 | |
| Zig ZAG (10): | 8.06 | |
| VORTEX (21): | 0.9400 | |
| Stochastique (14,3,5): | 19.89 | |
| TEMA (21): | 8.29 | |
| Williams %R (14): | -98.61 | |
| Chande Momentum Oscillator (20): | -0.60 | |
| Repulse (5,40,3): | -5.4300 | |
| ROCnROLL: | 2 | |
| TRIX (15,9): | 0.0000 | |
| Courbe Coppock: | 1.95 |
| MA7: | 8.27 | |
| MA20: | 8.35 | |
| MA50: | 8.33 | |
| MA100: | 8.71 | |
| MAexp7: | 8.27 | |
| MAexp20: | 8.32 | |
| MAexp50: | 8.41 | |
| MAexp100: | 8.55 | |
| Price / MA7: | -2.54% | |
| Price / MA20: | -3.47% | |
| Price / MA50: | -3.24% | |
| Price / MA100: | -7.46% | |
| Price / MAexp7: | -2.54% | |
| Price / MAexp20: | -3.13% | |
| Price / MAexp50: | -4.16% | |
| Price / MAexp100: | -5.73% |
News
Don't forget to follow the news on DIAMONDROCK HOSPITALITY CO.. At the time of publication of this analysis, the latest news was as follows:
- DIAMONDROCK HOSPITALITY ANNOUNCES SECOND QUARTER 2023 EARNINGS RELEASE AND CONFERENCE CALL
- DIAMONDROCK HOSPITALITY COMPANY DECLARES DIVIDENDS FOR SECOND QUARTER 2023
- DIAMONDROCK HOSPITALITY COMPANY REPORTS FIRST QUARTER RESULTS
- DIAMONDROCK HOSPITALITY ANNOUNCES FIRST QUARTER 2023 EARNINGS RELEASE AND CONFERENCE CALL
- DIAMONDROCK HOSPITALITY COMPANY DECLARES DIVIDENDS FOR FIRST QUARTER 2023
About author

Online


Add a comment
Comments
0 comments on the analysis DIAMONDROCK HOSPITALITY CO. - Daily