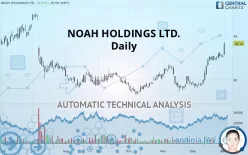
NOAH HOLDINGS LTD. - Daily - Technical analysis published on 01/03/2020 (GMT)
- 181
- 0
- Who voted?
Click here for a new analysis!
- Timeframe : Daily
- - Analysis generated on
- Status : INVALID

Summary of the analysis

Additional analysis
Quotes
The NOAH HOLDINGS LTD. rating is 38.33 USD. The price has increased by +8.37% since the last closing and was traded between 35.79 USD and 38.46 USD over the period. The price is currently at +7.10% from its lowest and -0.34% from its highest.The Central Gaps scanner detects a bullish opening marking the presence of buyers ahead of sellers at the opening but not sufficiently marked to allow the price to register a quotation gap.
Bullish opening
Type : Bullish
Timeframe : Openning
Here is a more detailed summary of the historical variations registered by NOAH HOLDINGS LTD.:
Near a new LOW record (1 month)
Type : Bearish
Timeframe : Weekly
Technical
Technical analysis of NOAH HOLDINGS LTD. in Daily shows a strongly overall bullish trend. The signals given by the moving averages are 89.29% bullish. This strong bullish trend is confirmed by the strong signals currently being given by short-term moving averages. The Central Indicators market scanner currently does not detect any result that concerns moving averages.
Technical indicators are strongly bullish, suggesting that the price increase should continue.
Caution: the Central Indicators scanner currently detects an excess:
Williams %R indicator is overbought : over -20
Type : Neutral
Timeframe : Daily
Pivot points : price is over resistance 2
Type : Neutral
Timeframe : Weekly
Pivot points : price is over resistance 3
Type : Neutral
Timeframe : Daily
Central Patterns, the scanner specializing in chart patterns, did not identify any signals.
Central Candlesticks, the scanner specialised in Japanese candlesticks, detects this inversion signal that could impact the current short-term trend:
White hanging man / hammer
Type : Neutral
Timeframe : Daily
| S3 | S2 | S1 | Price | R1 | R2 | R3 | |
|---|---|---|---|---|---|---|---|
| ProTrendLines | 28.77 | 31.40 | 37.32 | 38.33 | 44.92 | 50.57 | 56.82 |
| Change (%) | -24.94% | -18.08% | -2.64% | - | +17.19% | +31.93% | +48.24% |
| Change | -9.56 | -6.93 | -1.01 | - | +6.59 | +12.24 | +18.49 |
| Level | Major | Major | Major | - | Intermediate | Intermediate | Intermediate |
Pivot points can also be used to set your price objectives. Here is the price situation in relation to pivot points:
| Pivot points | S3 | S2 | S1 | PP | R1 | R2 | R3 |
|---|---|---|---|---|---|---|---|
| Standard | 34.28 | 34.74 | 35.06 | 35.52 | 35.84 | 36.30 | 36.62 |
| Camarilla | 35.16 | 35.23 | 35.30 | 35.37 | 35.44 | 35.51 | 35.59 |
| Woodie | 34.20 | 34.71 | 34.98 | 35.49 | 35.76 | 36.27 | 36.54 |
| Fibonacci | 34.74 | 35.04 | 35.23 | 35.52 | 35.82 | 36.01 | 36.30 |
| Pivot points | S3 | S2 | S1 | PP | R1 | R2 | R3 |
|---|---|---|---|---|---|---|---|
| Standard | 32.61 | 33.55 | 34.52 | 35.46 | 36.43 | 37.37 | 38.34 |
| Camarilla | 34.98 | 35.15 | 35.33 | 35.50 | 35.68 | 35.85 | 36.03 |
| Woodie | 32.64 | 33.56 | 34.55 | 35.47 | 36.46 | 37.38 | 38.37 |
| Fibonacci | 33.55 | 34.28 | 34.73 | 35.46 | 36.19 | 36.64 | 37.37 |
| Pivot points | S3 | S2 | S1 | PP | R1 | R2 | R3 |
|---|---|---|---|---|---|---|---|
| Standard | 21.66 | 24.81 | 30.09 | 33.24 | 38.52 | 41.67 | 46.95 |
| Camarilla | 33.05 | 33.82 | 34.60 | 35.37 | 36.14 | 36.92 | 37.69 |
| Woodie | 22.73 | 25.34 | 31.16 | 33.77 | 39.59 | 42.20 | 48.02 |
| Fibonacci | 24.81 | 28.03 | 30.02 | 33.24 | 36.46 | 38.45 | 41.67 |
Numerical data
The following is the status of the technical indicators and moving averages at the time of publication of this technical analysis:
| RSI (14): | 78.04 | |
| MACD (12,26,9): | 1.7300 | |
| Directional Movement: | 35.11 | |
| AROON (14): | 100.00 | |
| DEMA (21): | 36.02 | |
| Parabolic SAR (0,02-0,02-0,2): | 34.80 | |
| Elder Ray (13): | 2.24 | |
| Super Trend (3,10): | 33.44 | |
| Zig ZAG (10): | 38.33 | |
| VORTEX (21): | 1.2500 | |
| Stochastique (14,3,5): | 90.65 | |
| TEMA (21): | 37.09 | |
| Williams %R (14): | -1.49 | |
| Chande Momentum Oscillator (20): | 5.23 | |
| Repulse (5,40,3): | 7.8000 | |
| ROCnROLL: | 1 | |
| TRIX (15,9): | 0.6500 | |
| Courbe Coppock: | 38.77 |
| MA7: | 35.78 | |
| MA20: | 33.19 | |
| MA50: | 31.42 | |
| MA100: | 30.44 | |
| MAexp7: | 35.93 | |
| MAexp20: | 33.93 | |
| MAexp50: | 32.10 | |
| MAexp100: | 32.38 | |
| Price / MA7: | +7.13% | |
| Price / MA20: | +15.49% | |
| Price / MA50: | +21.99% | |
| Price / MA100: | +25.92% | |
| Price / MAexp7: | +6.68% | |
| Price / MAexp20: | +12.97% | |
| Price / MAexp50: | +19.41% | |
| Price / MAexp100: | +18.38% |
About author

Online


Add a comment
Comments
0 comments on the analysis NOAH HOLDINGS LTD. - Daily