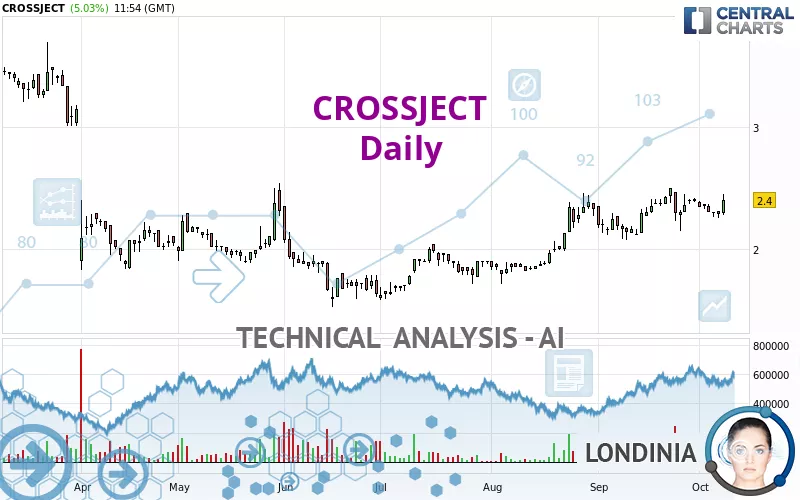
CROSSJECT - Daily - Technical analysis published on 10/08/2024 (GMT)
- 139
- 0
Click here for a new analysis!
- Timeframe : Daily
- - Analysis generated on
- Status : INVALID

Summary of the analysis

Additional analysis
Quotes
CROSSJECT rating 2.400 EUR. On the day, this instrument gained +5.03% and was traded between 2.275 EUR and 2.450 EUR over the period. The price is currently at +5.49% from its lowest and -2.04% from its highest.Here is a more detailed summary of the historical variations registered by CROSSJECT:
Near a new HIGH record (1 month)
Type : Bullish
Timeframe : Weekly
Technical
A technical analysis in Daily of this CROSSJECT chart shows a strongly bullish trend. 89.29% of the signals given by moving averages are bullish. The overall trend is supported by the strong bullish signals from short-term moving averages. An assessment of moving averages reveals a bullish signal that could impact this trend:
Bullish price crossover with Moving Average 20
Type : Bullish
Timeframe : Daily
The technical indicators are generally neutral. They do not provide relevant information on the direction of future price movements.
Other results related to technical indicators were also found by the Central Indicators scanner:
Pivot points : price is over resistance 1
Type : Neutral
Timeframe : Weekly
Pivot points : price is over resistance 3
Type : Neutral
Timeframe : Daily
Parabolic SAR indicator bullish reversal
Type : Bullish
Timeframe : Daily
Williams %R indicator is back over -50
Type : Bullish
Timeframe : Daily
An analysis of the price chart with the Central Patterns scanner (detector of chart patterns and resistances and supports) shows a result that can have an impact on the price change:
Near resistance of channel
Type : Bearish
Timeframe : Daily
No result was found by the Central Candlesticks scanner on Japanese candlesticks.
| S2 | S1 | Price | R1 | R2 | R3 | |
|---|---|---|---|---|---|---|
| ProTrendLines | 1.107 | 1.708 | 2.400 | 2.510 | 3.584 | 4.260 |
| Change (%) | -53.88% | -28.83% | - | +4.58% | +49.33% | +77.50% |
| Change | -1.293 | -0.692 | - | +0.110 | +1.184 | +1.860 |
| Level | Intermediate | Major | - | Major | Intermediate | Major |
To determine price objectives, it is also possible to use the pivot points. Here is the price position in relation to pivot points:
| Pivot points | S3 | S2 | S1 | PP | R1 | R2 | R3 |
|---|---|---|---|---|---|---|---|
| Standard | 2.202 | 2.228 | 2.257 | 2.283 | 2.312 | 2.338 | 2.367 |
| Camarilla | 2.270 | 2.275 | 2.280 | 2.285 | 2.290 | 2.295 | 2.300 |
| Woodie | 2.203 | 2.229 | 2.258 | 2.284 | 2.313 | 2.339 | 2.368 |
| Fibonacci | 2.228 | 2.249 | 2.262 | 2.283 | 2.304 | 2.317 | 2.338 |
| Pivot points | S3 | S2 | S1 | PP | R1 | R2 | R3 |
|---|---|---|---|---|---|---|---|
| Standard | 2.073 | 2.167 | 2.233 | 2.327 | 2.393 | 2.487 | 2.553 |
| Camarilla | 2.256 | 2.271 | 2.285 | 2.300 | 2.315 | 2.329 | 2.344 |
| Woodie | 2.060 | 2.160 | 2.220 | 2.320 | 2.380 | 2.480 | 2.540 |
| Fibonacci | 2.167 | 2.228 | 2.266 | 2.327 | 2.388 | 2.426 | 2.487 |
| Pivot points | S3 | S2 | S1 | PP | R1 | R2 | R3 |
|---|---|---|---|---|---|---|---|
| Standard | 1.710 | 1.890 | 2.140 | 2.320 | 2.570 | 2.750 | 3.000 |
| Camarilla | 2.272 | 2.311 | 2.351 | 2.390 | 2.429 | 2.469 | 2.508 |
| Woodie | 1.745 | 1.908 | 2.175 | 2.338 | 2.605 | 2.768 | 3.035 |
| Fibonacci | 1.890 | 2.054 | 2.156 | 2.320 | 2.484 | 2.586 | 2.750 |
Numerical data
The following is the status of the technical indicators and moving averages at the time of publication of this technical analysis:
| RSI (14): | 58.34 | |
| MACD (12,26,9): | 0.0460 | |
| Directional Movement: | 10.835 | |
| AROON (14): | -14.285 | |
| DEMA (21): | 2.384 | |
| Parabolic SAR (0,02-0,02-0,2): | 2.145 | |
| Elder Ray (13): | 0.030 | |
| Super Trend (3,10): | 2.138 | |
| Zig ZAG (10): | 2.390 | |
| VORTEX (21): | 1.0640 | |
| Stochastique (14,3,5): | 50.70 | |
| TEMA (21): | 2.359 | |
| Williams %R (14): | -30.99 | |
| Chande Momentum Oscillator (20): | -0.035 | |
| Repulse (5,40,3): | 3.0470 | |
| ROCnROLL: | 1 | |
| TRIX (15,9): | 0.4080 | |
| Courbe Coppock: | 2.51 |
| MA7: | 2.336 | |
| MA20: | 2.330 | |
| MA50: | 2.158 | |
| MA100: | 2.004 | |
| MAexp7: | 2.338 | |
| MAexp20: | 2.312 | |
| MAexp50: | 2.205 | |
| MAexp100: | 2.240 | |
| Price / MA7: | +2.74% | |
| Price / MA20: | +3.00% | |
| Price / MA50: | +11.21% | |
| Price / MA100: | +19.76% | |
| Price / MAexp7: | +2.65% | |
| Price / MAexp20: | +3.81% | |
| Price / MAexp50: | +8.84% | |
| Price / MAexp100: | +7.14% |
News
Don't forget to follow the news on CROSSJECT. At the time of publication of this analysis, the latest news was as follows:
- Crossject to report first-half 2024 financial results and host webcast on September 23, 2024
- Crossject to attend H.C. Wainwright 26th Annual Global Investment Conference
- Crossject is awarded a 6.9 million euros financing from the French Government, as part of the France 2030 innovation plan, to accelerate the development of ZENEO® Epinephrine
- Crossject appoints Dan Chiche, MD as Chief Medical Officer North America
- Crossject announces highly successful closing of its €8 million rights offering
About author

Online


Add a comment
Comments
0 comments on the analysis CROSSJECT - Daily