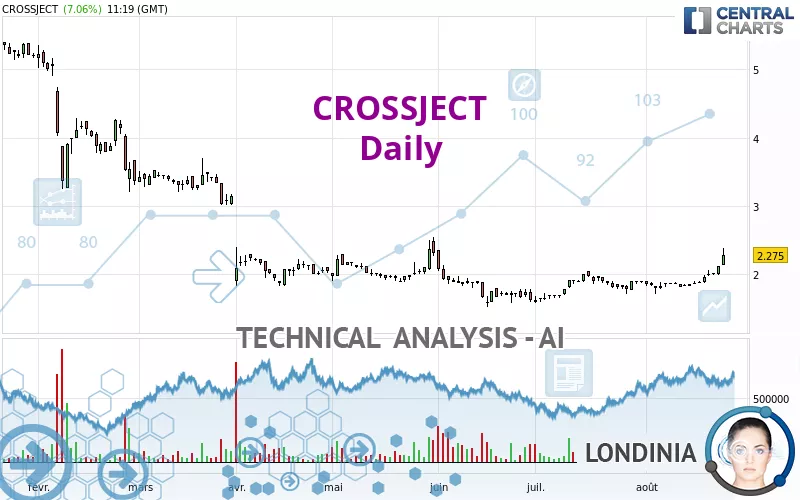
CROSSJECT - Daily - Technical analysis published on 08/23/2024 (GMT)
- 171
- 0
Click here for a new analysis!
- Timeframe : Daily
- - Analysis generated on
- Status : TARGET REACHED

Summary of the analysis

Additional analysis
Quotes
CROSSJECT rating 2.275 EUR. On the day, this instrument gained +7.06% and was traded between 2.140 EUR and 2.385 EUR over the period. The price is currently at +6.31% from its lowest and -4.61% from its highest.The Central Gaps scanner detects the formation of a bullish gap marking the strong presence of buyers against sellers at the opening. This formed a quotation gap.
Opening Gap UP
Type : Bullish
Timeframe : Openning
A study of price movements over other periods shows the following variations:
New HIGH record (1 month)
Type : Bullish
Timeframe : Weekly
Technical
A technical analysis in Daily of this CROSSJECT chart shows a bullish trend. The signals returned by the moving averages are 78.57% bullish. This bullish trend is reinforced by the strong signals currently being given by short-term moving averages. The Central Indicators scanner detects a bullish signal on moving averages that could impact this trend:
Bullish trend reversal : Moving Average 100
Type : Bullish
Timeframe : Daily
Technical indicators are strongly bullish, suggesting that the price increase should continue.
But beware of excesses. The Central Indicators scanner currently detects this:
RSI indicator is overbought : over 70
Type : Neutral
Timeframe : Daily
CCI indicator is overbought : over 100
Type : Neutral
Timeframe : Daily
Williams %R indicator is overbought : over -20
Type : Neutral
Timeframe : Daily
Pivot points : price is over resistance 2
Type : Neutral
Timeframe : Daily
Pivot points : price is over resistance 3
Type : Neutral
Timeframe : Weekly
Central Patterns, the scanner specializing in chart patterns, did not identify any signals.
Central Candlesticks, the scanner specialised in Japanese candlesticks, detects these bullish signals that could support the hypothesis of a small rebound in the very short term:
White line without lower shadow
Type : Bullish
Timeframe : Daily
Upside gap
Type : Bullish
Timeframe : Daily
Long white line
Type : Bullish
Timeframe : Daily
| S2 | S1 | Price | R1 | R2 | R3 | |
|---|---|---|---|---|---|---|
| ProTrendLines | 1.107 | 1.708 | 2.275 | 2.510 | 3.584 | 4.260 |
| Change (%) | -51.34% | -24.92% | - | +10.33% | +57.54% | +87.25% |
| Change | -1.168 | -0.567 | - | +0.235 | +1.309 | +1.985 |
| Level | Intermediate | Major | - | Major | Intermediate | Major |
Pivot points can also be used to set your price objectives. Here is the price situation in relation to pivot points:
| Pivot points | S3 | S2 | S1 | PP | R1 | R2 | R3 |
|---|---|---|---|---|---|---|---|
| Standard | 1.887 | 1.934 | 2.030 | 2.077 | 2.173 | 2.220 | 2.316 |
| Camarilla | 2.086 | 2.099 | 2.112 | 2.125 | 2.138 | 2.151 | 2.164 |
| Woodie | 1.911 | 1.946 | 2.054 | 2.089 | 2.197 | 2.232 | 2.340 |
| Fibonacci | 1.934 | 1.989 | 2.023 | 2.077 | 2.132 | 2.166 | 2.220 |
| Pivot points | S3 | S2 | S1 | PP | R1 | R2 | R3 |
|---|---|---|---|---|---|---|---|
| Standard | 1.747 | 1.783 | 1.827 | 1.863 | 1.907 | 1.943 | 1.987 |
| Camarilla | 1.848 | 1.855 | 1.863 | 1.870 | 1.877 | 1.885 | 1.892 |
| Woodie | 1.750 | 1.785 | 1.830 | 1.865 | 1.910 | 1.945 | 1.990 |
| Fibonacci | 1.783 | 1.814 | 1.833 | 1.863 | 1.894 | 1.913 | 1.943 |
| Pivot points | S3 | S2 | S1 | PP | R1 | R2 | R3 |
|---|---|---|---|---|---|---|---|
| Standard | 1.172 | 1.376 | 1.632 | 1.836 | 2.092 | 2.296 | 2.552 |
| Camarilla | 1.762 | 1.804 | 1.846 | 1.888 | 1.930 | 1.972 | 2.015 |
| Woodie | 1.198 | 1.389 | 1.658 | 1.849 | 2.118 | 2.309 | 2.578 |
| Fibonacci | 1.376 | 1.552 | 1.660 | 1.836 | 2.012 | 2.120 | 2.296 |
Numerical data
The following is the status of the technical indicators and moving averages at the time of publication of this technical analysis:
| RSI (14): | 79.04 | |
| MACD (12,26,9): | 0.0690 | |
| Directional Movement: | 36.751 | |
| AROON (14): | 100.000 | |
| DEMA (21): | 2.017 | |
| Parabolic SAR (0,02-0,02-0,2): | 1.796 | |
| Elder Ray (13): | 0.279 | |
| Super Trend (3,10): | 1.987 | |
| Zig ZAG (10): | 2.280 | |
| VORTEX (21): | 1.1750 | |
| Stochastique (14,3,5): | 88.01 | |
| TEMA (21): | 2.081 | |
| Williams %R (14): | -17.65 | |
| Chande Momentum Oscillator (20): | 0.430 | |
| Repulse (5,40,3): | 10.8270 | |
| ROCnROLL: | 1 | |
| TRIX (15,9): | 0.2290 | |
| Courbe Coppock: | 20.00 |
| MA7: | 2.016 | |
| MA20: | 1.910 | |
| MA50: | 1.827 | |
| MA100: | 1.931 | |
| MAexp7: | 2.056 | |
| MAexp20: | 1.944 | |
| MAexp50: | 1.928 | |
| MAexp100: | 2.175 | |
| Price / MA7: | +12.85% | |
| Price / MA20: | +19.11% | |
| Price / MA50: | +24.52% | |
| Price / MA100: | +17.81% | |
| Price / MAexp7: | +10.65% | |
| Price / MAexp20: | +17.03% | |
| Price / MAexp50: | +18.00% | |
| Price / MAexp100: | +4.60% |
News
Don't forget to follow the news on CROSSJECT. At the time of publication of this analysis, the latest news was as follows:
- Crossject to attend H.C. Wainwright 26th Annual Global Investment Conference
- Crossject is awarded a 6.9 million euros financing from the French Government, as part of the France 2030 innovation plan, to accelerate the development of ZENEO® Epinephrine
- Crossject appoints Dan Chiche, MD as Chief Medical Officer North America
- Crossject announces highly successful closing of its €8 million rights offering
- Crossject trading on Euronext to resume as usual on Wednesday April 3
About author
Online


Add a comment
Comments
0 comments on the analysis CROSSJECT - Daily