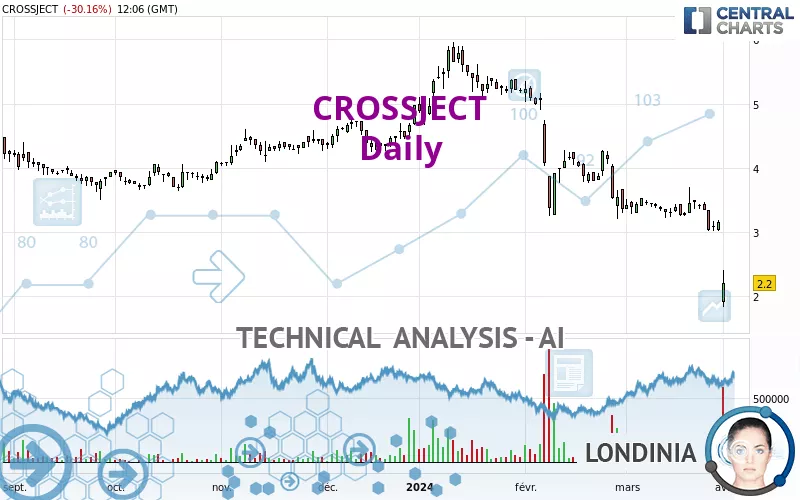
CROSSJECT - Daily - Technical analysis published on 04/03/2024 (GMT)
- 124
- 0
Click here for a new analysis!
- Timeframe : Daily
- - Analysis generated on
- Status : TARGET REACHED
Summary of the analysis

Additional analysis
Quotes
CROSSJECT rating 2.200 EUR. The price registered a decrease of -30.16% on the session and was traded between 1.828 EUR and 2.400 EUR over the period. The price is currently at +20.35% from its lowest and -8.33% from its highest.A bearish gap was detected at the opening by the Central Gaps scanner. There are a lot of sellers and they have the upper hand in the very short term.
Opening Gap DOWN
Type : Bearish
Timeframe : Openning
A study of price movements over other periods shows the following variations:
New LOW record (1 year)
Type : Bearish
Timeframe : Weekly
New LOW record (1st january)
Type : Bearish
Timeframe : Weekly
New LOW record (1 month)
Type : Bearish
Timeframe : Weekly
The Central Volumes scanner notes the presence of abnormal volumes:
Abnormal volumes
Timeframe : 5 days
Technical
A technical analysis in Daily of this CROSSJECT chart shows a sharp bearish trend. 92.86% of the signals given by moving averages are bearish. The overall trend is supported by the strong bearish signals from short-term moving averages. The Central Indicators market scanner currently does not detect any result that concerns moving averages.
On the 18 technical indicators analysed, 5 are bullish, 3 are neutral and 10 are bearish. Caution: the Central Indicators scanner currently detects an excess:
RSI indicator is oversold : under 30
Type : Neutral
Timeframe : Daily
CCI indicator is oversold : under -100
Type : Neutral
Timeframe : Daily
Pivot points : price is under support 3
Type : Neutral
Timeframe : Daily
Pivot points : price is under support 3
Type : Neutral
Timeframe : Weekly
MACD crosses DOWN its Moving Average
Type : Bearish
Timeframe : Daily
An analysis of the price chart with the Central Patterns scanner (detector of chart patterns and resistances and supports) shows a result that can have an impact on the price change:
Support of channel is broken
Type : Bearish
Timeframe : Daily
The Central Candlesticks scanner, specialised in Japanese candlesticks, did not identify any signals.
| S3 | S2 | S1 | Price | R1 | R2 | R3 | |
|---|---|---|---|---|---|---|---|
| ProTrendLines | 1.107 | 1.708 | 2.177 | 2.200 | 2.510 | 3.259 | 3.678 |
| Change (%) | -49.68% | -22.36% | -1.05% | - | +14.09% | +48.14% | +67.18% |
| Change | -1.093 | -0.492 | -0.023 | - | +0.310 | +1.059 | +1.478 |
| Level | Intermediate | Intermediate | Minor | - | Intermediate | Intermediate | Major |
Attention could also be paid to pivot points to set price objectives:
| Pivot points | S3 | S2 | S1 | PP | R1 | R2 | R3 |
|---|---|---|---|---|---|---|---|
| Standard | 2.877 | 2.943 | 3.047 | 3.113 | 3.217 | 3.283 | 3.387 |
| Camarilla | 3.103 | 3.119 | 3.134 | 3.150 | 3.166 | 3.181 | 3.197 |
| Woodie | 2.895 | 2.953 | 3.065 | 3.123 | 3.235 | 3.293 | 3.405 |
| Fibonacci | 2.943 | 3.008 | 3.048 | 3.113 | 3.178 | 3.218 | 3.283 |
| Pivot points | S3 | S2 | S1 | PP | R1 | R2 | R3 |
|---|---|---|---|---|---|---|---|
| Standard | 2.490 | 2.750 | 2.950 | 3.210 | 3.410 | 3.670 | 3.870 |
| Camarilla | 3.024 | 3.066 | 3.108 | 3.150 | 3.192 | 3.234 | 3.277 |
| Woodie | 2.460 | 2.735 | 2.920 | 3.195 | 3.380 | 3.655 | 3.840 |
| Fibonacci | 2.750 | 2.926 | 3.034 | 3.210 | 3.386 | 3.494 | 3.670 |
| Pivot points | S3 | S2 | S1 | PP | R1 | R2 | R3 |
|---|---|---|---|---|---|---|---|
| Standard | 2.183 | 2.597 | 2.873 | 3.287 | 3.563 | 3.977 | 4.253 |
| Camarilla | 2.960 | 3.024 | 3.087 | 3.150 | 3.213 | 3.277 | 3.340 |
| Woodie | 2.115 | 2.563 | 2.805 | 3.253 | 3.495 | 3.943 | 4.185 |
| Fibonacci | 2.597 | 2.860 | 3.023 | 3.287 | 3.550 | 3.713 | 3.977 |
Numerical data
The following is the status of the technical indicators and moving averages at the time of publication of this technical analysis:
| RSI (14): | 21.88 | |
| MACD (12,26,9): | -0.2810 | |
| Directional Movement: | -38.022 | |
| AROON (14): | -50.000 | |
| DEMA (21): | 2.923 | |
| Parabolic SAR (0,02-0,02-0,2): | 3.823 | |
| Elder Ray (13): | -1.035 | |
| Super Trend (3,10): | 3.020 | |
| Zig ZAG (10): | 2.235 | |
| VORTEX (21): | 0.7530 | |
| Stochastique (14,3,5): | 17.88 | |
| TEMA (21): | 2.889 | |
| Williams %R (14): | -78.26 | |
| Chande Momentum Oscillator (20): | -1.075 | |
| Repulse (5,40,3): | 15.9390 | |
| ROCnROLL: | 2 | |
| TRIX (15,9): | -0.9310 | |
| Courbe Coppock: | 21.37 |
| MA7: | 3.105 | |
| MA20: | 3.288 | |
| MA50: | 3.955 | |
| MA100: | 4.332 | |
| MAexp7: | 2.975 | |
| MAexp20: | 3.293 | |
| MAexp50: | 3.755 | |
| MAexp100: | 4.021 | |
| Price / MA7: | -29.15% | |
| Price / MA20: | -33.09% | |
| Price / MA50: | -44.37% | |
| Price / MA100: | -49.22% | |
| Price / MAexp7: | -26.05% | |
| Price / MAexp20: | -33.19% | |
| Price / MAexp50: | -41.41% | |
| Price / MAexp100: | -45.29% |
News
The latest news and videos published on CROSSJECT at the time of the analysis were as follows:
- Crossject trading on Euronext to resume as usual on Wednesday April 3
- Crossject advances in its U.S. Strategy and reports Financial Results for 2023
- Crossject gender equality score reaches 96/100 in 2024
- Crossject obtains a financing up to €12 million, in two tranches
- Crossject to host a business briefing on commercial strategy on February 6 at 17:30 CET
About author

Online


Add a comment
Comments
0 comments on the analysis CROSSJECT - Daily