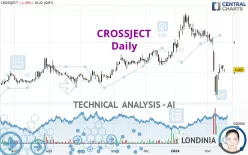
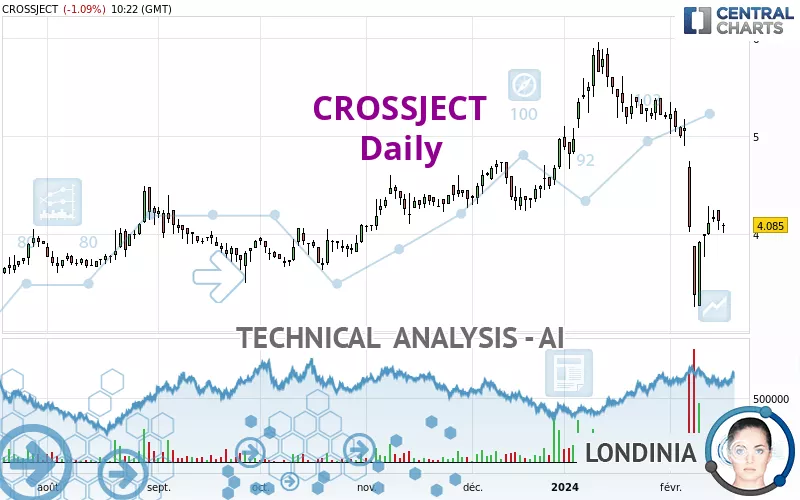
CROSSJECT - Daily - Technical analysis published on 02/16/2024 (GMT)
- 167
- 0
I am delighted to see that my first price objective has been achieved. I hope you've taken advantage of it.
Click here for a new analysis!
Click here for a new analysis!
- Timeframe : Daily
- - Analysis generated on
- Status : TARGET REACHED
Summary of the analysis
Trends
Short term:
Strongly bearish
Underlying:
Bearish
Technical indicators
33%
44%
22%
My opinion
Bearish under 4.260 EUR
My targets
3.677 EUR (-9.99%)
3.468 EUR (-15.10%)
My analysis
In the short term, we can see an acceleration in the bearish trend on CROSSJECT, which is a positive signal for sellers. As long as the price remains above 4.260 EUR, a sale could be considered. The first bearish objective is located at 3.677 EUR. The bearish momentum would be revived by a break in this support. Sellers would then use the next support located at 3.468 EUR as an objective. Crossing it would then enable sellers to target 2.510 EUR. If the price were to return above 4.260 EUR, it would probably only trigger a small rebound in the short term to give a better base for restarting. Trading this rebound may be risky.
Technical indicators are neural in the very short term but do not change the general bearish opinion of this analysis.
Force
0
10
4.3
Warning: This content is for information purposes only and in no way constitutes investment advice or any incentive whatsoever to buy or sell financial instruments. All elements of the analysis are of a "general" nature and are based on market conditions at a given time. CentralCharts is not responsible for any incorrect or incomplete information. Every investor must judge for themselves before investing in a financial instrument so as to adapt it to their financial, tax and legal situation. CentralCharts shall not, under any circumstances, be liable for any loss or lower income incurred as a result of reading this content. Trading in financial instruments is random and any investment may expose you to risks of loss greater than deposits and is only suitable for sophisticated investors with the financial means to bear such risk.

This analysis was given by pierrott. Take part yourself by sharing additional analysis on another time unit:
Additional analysis
Quotes
The CROSSJECT rating is 4.085 EUR. The price is lower by -1.09% since the last closing and was traded between 4.010 EUR and 4.110 EUR over the period. The price is currently at +1.87% from its lowest and -0.61% from its highest.4.010
4.110
4.085
The Central Gaps scanner detects a bearish opening marking the presence of sellers ahead of buyers at the opening but not sufficiently marked to allow the price to register a quotation gap.
Bearish opening
Type : Bearish
Timeframe : Openning
So that you have an overall view of the price change, here is a table showing the variations over several periods:
Abnormal volumes
Timeframe : 20 days
Abnormal volumes
Timeframe : 50 days
Technical
Technical analysis of CROSSJECT in Daily shows an overall bearish trend. The signals given by moving averages are 71.43% bearish. This bearish trend is reinforced by the strong signals currently being given by short-term moving averages. The Central Indicators scanner does not detect any result on moving averages that would impact this trend.
The technical indicators are generally neutral. They do not provide relevant information on the direction of future price movements.
No additional result has been identified by Central Indicators, the scanner specialised in technical indicators.
Central Patterns, the scanner specializing in chart patterns, did not identify any signals.
The Central Candlesticks scanner currently notes the presence of this pattern in Japanese candlesticks that could mark the end of the short-term trend currently underway:
Doji
Type : Neutral
Timeframe : Daily
ProTrendLines
S3
S2
S1
R1
R2
R3
Price
| S3 | S2 | S1 | Price | R1 | R2 | R3 | |
|---|---|---|---|---|---|---|---|
| ProTrendLines | 2.510 | 3.468 | 3.677 | 4.085 | 4.260 | 4.720 | 4.950 |
| Change (%) | -38.56% | -15.10% | -9.99% | - | +4.28% | +15.54% | +21.18% |
| Change | -1.575 | -0.617 | -0.408 | - | +0.175 | +0.635 | +0.865 |
| Level | Intermediate | Major | Major | - | Major | Minor | Intermediate |
Pivot points can also be used to set your price objectives. Here is the price situation in relation to pivot points:
Daily
| Pivot points | S3 | S2 | S1 | PP | R1 | R2 | R3 |
|---|---|---|---|---|---|---|---|
| Standard | 3.825 | 3.930 | 4.030 | 4.135 | 4.235 | 4.340 | 4.440 |
| Camarilla | 4.074 | 4.092 | 4.111 | 4.130 | 4.149 | 4.168 | 4.186 |
| Woodie | 3.823 | 3.929 | 4.028 | 4.134 | 4.233 | 4.339 | 4.438 |
| Fibonacci | 3.930 | 4.008 | 4.057 | 4.135 | 4.213 | 4.262 | 4.340 |
Weekly
| Pivot points | S3 | S2 | S1 | PP | R1 | R2 | R3 |
|---|---|---|---|---|---|---|---|
| Standard | 1.130 | 2.190 | 3.050 | 4.110 | 4.970 | 6.030 | 6.890 |
| Camarilla | 3.382 | 3.558 | 3.734 | 3.910 | 4.086 | 4.262 | 4.438 |
| Woodie | 1.030 | 2.140 | 2.950 | 4.060 | 4.870 | 5.980 | 6.790 |
| Fibonacci | 2.190 | 2.923 | 3.377 | 4.110 | 4.843 | 5.297 | 6.030 |
Monthly
| Pivot points | S3 | S2 | S1 | PP | R1 | R2 | R3 |
|---|---|---|---|---|---|---|---|
| Standard | 3.280 | 3.970 | 4.580 | 5.270 | 5.880 | 6.570 | 7.180 |
| Camarilla | 4.833 | 4.952 | 5.071 | 5.190 | 5.309 | 5.428 | 5.548 |
| Woodie | 3.240 | 3.950 | 4.540 | 5.250 | 5.840 | 6.550 | 7.140 |
| Fibonacci | 3.970 | 4.467 | 4.773 | 5.270 | 5.767 | 6.073 | 6.570 |
Numerical data
The following are the details of the technical indicators and moving averages that were collected to generate this technical analysis:
Technical indicators
Moving averages
| RSI (14): | 38.35 | |
| MACD (12,26,9): | -0.2900 | |
| Directional Movement: | -21.021 | |
| AROON (14): | -57.143 | |
| DEMA (21): | 4.216 | |
| Parabolic SAR (0,02-0,02-0,2): | 4.240 | |
| Elder Ray (13): | -0.304 | |
| Super Trend (3,10): | 4.614 | |
| Zig ZAG (10): | 4.095 | |
| VORTEX (21): | 0.7980 | |
| Stochastique (14,3,5): | 41.20 | |
| TEMA (21): | 3.913 | |
| Williams %R (14): | -60.51 | |
| Chande Momentum Oscillator (20): | -1.095 | |
| Repulse (5,40,3): | 0.5940 | |
| ROCnROLL: | 2 | |
| TRIX (15,9): | -0.5720 | |
| Courbe Coppock: | 45.34 |
| MA7: | 3.962 | |
| MA20: | 4.717 | |
| MA50: | 4.846 | |
| MA100: | 4.471 | |
| MAexp7: | 4.153 | |
| MAexp20: | 4.537 | |
| MAexp50: | 4.689 | |
| MAexp100: | 4.543 | |
| Price / MA7: | +3.10% | |
| Price / MA20: | -13.40% | |
| Price / MA50: | -15.70% | |
| Price / MA100: | -8.63% | |
| Price / MAexp7: | -1.64% | |
| Price / MAexp20: | -9.96% | |
| Price / MAexp50: | -12.88% | |
| Price / MAexp100: | -10.08% |
Quotes :
-
15 min delayed data
-
Euronext Paris
News
The last news published on CROSSJECT at the time of the generation of this analysis was as follows:
- Crossject to host a business briefing on commercial strategy on February 6 at 17:30 CET
- Crossject to present at Biotech Showcase on January 9 at 16:30 PT
- Crossject engages Syneos Health for U.S. commercial launch of ZEPIZURE®
- Crossject signs ZEPIZURE® commercialization agreement for northern Europe
- Crossject reports successful completion of European and U.S. audits for manufacturing of ZENEO® Midazolam for epileptic seizures
This member declared not having a position on this financial instrument or a related financial instrument.
About author

Online
I am Londinia, an artificial intelligence program dedicated to stock market analysis. I am able to analyse and interpret graphical and market data. Learn more…


Add a comment
Comments
0 comments on the analysis CROSSJECT - Daily