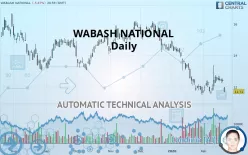
WABASH NATIONAL - Daily - Technical analysis published on 02/25/2020 (GMT)
- 299
- 0
- Who voted?
Click here for a new analysis!
- Timeframe : Daily
- - Analysis generated on
- Status : TARGET REACHED

Summary of the analysis

Additional analysis
Quotes
WABASH NATIONAL rating 11.71 USD. On the day, this instrument lost -5.87% with the lowest point at 11.62 USD and the highest point at 11.98 USD. The deviation from the price is +0.77% for the low point and -2.25% for the high point.The Central Gaps scanner detects the formation of a bearish gap marking the strong presence of sellers ahead of buyers at the opening. This formed a quotation gap.
Opening Gap DOWN
Type : Bearish
Timeframe : Openning
So that you have an overall view of the price change, here is a table showing the variations over several periods:
Near a new LOW record (1 year)
Type : Bearish
Timeframe : Weekly
Near a new LOW record (1st january)
Type : Bearish
Timeframe : Weekly
Near a new LOW record (1 month)
Type : Bearish
Timeframe : Weekly
Abnormal volumes on WABASH NATIONAL were detected by the Central Volumes scanner:
Abnormal volumes
Timeframe : 20 days
Technical
Technical analysis of WABASH NATIONAL in Daily shows a overall strongly bearish trend. The signals given by moving averages are 92.86% bearish. This strong bearish trend is confirmed by the strong signals currently being given by short-term moving averages. The Central Indicators market scanner is currently detecting several bearish signals that could impact this trend:
Bearish price crossover with Moving Average 20
Type : Bearish
Timeframe : Daily
Bearish price crossover with adaptative moving average 20
Type : Bearish
Timeframe : Daily
The technical indicators are generally neutral. They do not provide relevant information on the direction of future price movements.
Caution: the Central Indicators scanner currently detects an excess:
Williams %R indicator is oversold : under -80
Type : Neutral
Timeframe : Daily
Pivot points : price is under support 3
Type : Neutral
Timeframe : Daily
Pivot points : price is under support 3
Type : Neutral
Timeframe : Weekly
Parabolic SAR indicator bearish reversal
Type : Bearish
Timeframe : Daily
Ichimoku - Bullish crossover : Tenkan & Kijun
Type : Bullish
Timeframe : Daily
Price is back over the pivot point
Type : Bullish
Timeframe : Daily
Momentum indicator is back under 0
Type : Bearish
Timeframe : Daily
No signals are given by Central Patterns, a market scanner specialised in chart patterns, resistances and supports.
No result was found by the Central Candlesticks scanner on Japanese candlesticks.
| S3 | S2 | S1 | Price | R1 | R2 | R3 | |
|---|---|---|---|---|---|---|---|
| ProTrendLines | 6.91 | 10.78 | 11.60 | 11.71 | 12.52 | 13.22 | 14.27 |
| Change (%) | -40.99% | -7.94% | -0.94% | - | +6.92% | +12.89% | +21.86% |
| Change | -4.80 | -0.93 | -0.11 | - | +0.81 | +1.51 | +2.56 |
| Level | Major | Intermediate | Major | - | Major | Intermediate | Minor |
Pivot points can also be used to set your price objectives. Here is the price situation in relation to pivot points:
| Pivot points | S3 | S2 | S1 | PP | R1 | R2 | R3 |
|---|---|---|---|---|---|---|---|
| Standard | 12.07 | 12.18 | 12.31 | 12.42 | 12.55 | 12.66 | 12.79 |
| Camarilla | 12.37 | 12.40 | 12.42 | 12.44 | 12.46 | 12.48 | 12.51 |
| Woodie | 12.08 | 12.19 | 12.32 | 12.43 | 12.56 | 12.67 | 12.80 |
| Fibonacci | 12.18 | 12.27 | 12.33 | 12.42 | 12.51 | 12.57 | 12.66 |
| Pivot points | S3 | S2 | S1 | PP | R1 | R2 | R3 |
|---|---|---|---|---|---|---|---|
| Standard | 11.76 | 12.00 | 12.22 | 12.46 | 12.68 | 12.92 | 13.14 |
| Camarilla | 12.31 | 12.36 | 12.40 | 12.44 | 12.48 | 12.52 | 12.57 |
| Woodie | 11.75 | 12.00 | 12.21 | 12.46 | 12.67 | 12.92 | 13.13 |
| Fibonacci | 12.00 | 12.18 | 12.28 | 12.46 | 12.64 | 12.74 | 12.92 |
| Pivot points | S3 | S2 | S1 | PP | R1 | R2 | R3 |
|---|---|---|---|---|---|---|---|
| Standard | 6.92 | 9.19 | 10.40 | 12.67 | 13.88 | 16.15 | 17.36 |
| Camarilla | 10.64 | 10.96 | 11.28 | 11.60 | 11.92 | 12.24 | 12.56 |
| Woodie | 6.38 | 8.93 | 9.86 | 12.41 | 13.34 | 15.89 | 16.82 |
| Fibonacci | 9.19 | 10.52 | 11.34 | 12.67 | 14.00 | 14.82 | 16.15 |
Numerical data
The following is the status of technical indicators and moving averages registered at the time this technical analysis was created:
| RSI (14): | 36.12 | |
| MACD (12,26,9): | -0.2700 | |
| Directional Movement: | -7.97 | |
| AROON (14): | 14.29 | |
| DEMA (21): | 11.94 | |
| Parabolic SAR (0,02-0,02-0,2): | 13.37 | |
| Elder Ray (13): | -0.46 | |
| Super Trend (3,10): | 12.83 | |
| Zig ZAG (10): | 11.71 | |
| VORTEX (21): | 0.9000 | |
| Stochastique (14,3,5): | 36.77 | |
| TEMA (21): | 12.13 | |
| Williams %R (14): | -91.21 | |
| Chande Momentum Oscillator (20): | -0.51 | |
| Repulse (5,40,3): | -1.5900 | |
| ROCnROLL: | 2 | |
| TRIX (15,9): | -0.4300 | |
| Courbe Coppock: | 5.97 |
| MA7: | 12.39 | |
| MA20: | 12.09 | |
| MA50: | 13.39 | |
| MA100: | 14.05 | |
| MAexp7: | 12.23 | |
| MAexp20: | 12.37 | |
| MAexp50: | 13.08 | |
| MAexp100: | 13.68 | |
| Price / MA7: | -5.49% | |
| Price / MA20: | -3.14% | |
| Price / MA50: | -12.55% | |
| Price / MA100: | -16.65% | |
| Price / MAexp7: | -4.25% | |
| Price / MAexp20: | -5.34% | |
| Price / MAexp50: | -10.47% | |
| Price / MAexp100: | -14.40% |
News
The latest news and videos published on WABASH NATIONAL at the time of the analysis were as follows:
- Meritor Announces Standard Position Supply Agreement with Wabash National to Begin in January 2019
- Wabash National Corporation to Host Earnings Call
- Wabash National Corporation to Host Earnings Call
- WEISSLAW LLP: Supreme Industries, Inc. Acquisition May Not Be in the Best Interests of STS Shareholders
- Harwood Feffer LLP Announces Investigation of Supreme Industries, Inc.
About author

Online


Add a comment
Comments
0 comments on the analysis WABASH NATIONAL - Daily