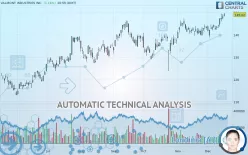
VALMONT INDUSTRIES INC. - Daily - Technical analysis published on 12/18/2019 (GMT)
- 284
- 0
- Who voted?
Click here for a new analysis!
- Timeframe : Daily
- - Analysis generated on
- Status : LEVEL MAINTAINED

Summary of the analysis

Additional analysis
Quotes
The VALMONT INDUSTRIES INC. price is 149.02 USD. On the day, this instrument gained +1.16% with the lowest point at 148.08 USD and the highest point at 149.74 USD. The deviation from the price is +0.63% for the low point and -0.48% for the high point.A bullish opening was detected by the Central Gaps scanner. Buyers are trying to impose a bullish momentum in the very short term.
Bullish opening
Type : Bullish
Timeframe : Openning
Here is a more detailed summary of the historical variations registered by VALMONT INDUSTRIES INC.:
New HIGH record (1 year)
Type : Bullish
Timeframe : Weekly
New HIGH record (1st january)
Type : Bullish
Timeframe : Weekly
New HIGH record (1 month)
Type : Bullish
Timeframe : Weekly
Technical
Technical analysis of this Daily chart of VALMONT INDUSTRIES INC. indicates that the overall trend is strongly bullish. 92.86% of the signals given by moving averages are bullish. The overall trend is supported by the strong bullish signals from short-term moving averages. The Central Indicators market scanner currently does not detect any result that concerns moving averages.
In fact, 15 technical indicators on 18 studied are currently bullish. Caution: the Central Indicators scanner currently detects an excess:
RSI indicator is overbought : over 70
Type : Neutral
Timeframe : Daily
CCI indicator is overbought : over 100
Type : Neutral
Timeframe : Daily
Williams %R indicator is overbought : over -20
Type : Neutral
Timeframe : Daily
Pivot points : price is over resistance 1
Type : Neutral
Timeframe : Daily
Price is back over the pivot point
Type : Bullish
Timeframe : Weekly
Price is back under the pivot point
Type : Bearish
Timeframe : Daily
No signals are given by Central Patterns, a market scanner specialised in chart patterns, resistances and supports.
The Central Candlesticks scanner, specialised in Japanese candlesticks, did not identify any signals.
| S3 | S2 | S1 | Price | R1 | R2 | |
|---|---|---|---|---|---|---|
| ProTrendLines | 139.11 | 143.29 | 146.00 | 149.02 | 159.83 | 172.85 |
| Change (%) | -6.65% | -3.85% | -2.03% | - | +7.25% | +15.99% |
| Change | -9.91 | -5.73 | -3.02 | - | +10.81 | +23.83 |
| Level | Major | Intermediate | Minor | - | Intermediate | Major |
Pivot points can also be used to set your price objectives. Here is the price situation in relation to pivot points:
| Pivot points | S3 | S2 | S1 | PP | R1 | R2 | R3 |
|---|---|---|---|---|---|---|---|
| Standard | 144.23 | 145.62 | 146.46 | 147.85 | 148.69 | 150.08 | 150.92 |
| Camarilla | 146.70 | 146.90 | 147.11 | 147.31 | 147.51 | 147.72 | 147.92 |
| Woodie | 143.97 | 145.48 | 146.20 | 147.71 | 148.43 | 149.94 | 150.66 |
| Fibonacci | 145.62 | 146.47 | 147.00 | 147.85 | 148.70 | 149.23 | 150.08 |
| Pivot points | S3 | S2 | S1 | PP | R1 | R2 | R3 |
|---|---|---|---|---|---|---|---|
| Standard | 135.89 | 139.10 | 143.02 | 146.23 | 150.16 | 153.37 | 157.29 |
| Camarilla | 144.99 | 145.64 | 146.30 | 146.95 | 147.60 | 148.26 | 148.91 |
| Woodie | 136.25 | 139.28 | 143.38 | 146.41 | 150.52 | 153.55 | 157.65 |
| Fibonacci | 139.10 | 141.82 | 143.51 | 146.23 | 148.96 | 150.64 | 153.37 |
| Pivot points | S3 | S2 | S1 | PP | R1 | R2 | R3 |
|---|---|---|---|---|---|---|---|
| Standard | 129.61 | 134.03 | 138.53 | 142.95 | 147.45 | 151.87 | 156.37 |
| Camarilla | 140.57 | 141.39 | 142.20 | 143.02 | 143.84 | 144.66 | 145.47 |
| Woodie | 129.64 | 134.05 | 138.56 | 142.97 | 147.48 | 151.89 | 156.40 |
| Fibonacci | 134.03 | 137.44 | 139.55 | 142.95 | 146.36 | 148.47 | 151.87 |
Numerical data
The following are the details of the technical indicators and moving averages that were collected to generate this technical analysis:
| RSI (14): | 70.88 | |
| MACD (12,26,9): | 1.7700 | |
| Directional Movement: | 12.92 | |
| AROON (14): | 71.43 | |
| DEMA (21): | 146.30 | |
| Parabolic SAR (0,02-0,02-0,2): | 140.37 | |
| Elder Ray (13): | 3.81 | |
| Super Trend (3,10): | 141.53 | |
| Zig ZAG (10): | 149.02 | |
| VORTEX (21): | 1.0700 | |
| Stochastique (14,3,5): | 83.46 | |
| TEMA (21): | 146.96 | |
| Williams %R (14): | -6.53 | |
| Chande Momentum Oscillator (20): | 6.00 | |
| Repulse (5,40,3): | 0.0300 | |
| ROCnROLL: | 1 | |
| TRIX (15,9): | 0.1300 | |
| Courbe Coppock: | 5.83 |
| MA7: | 145.85 | |
| MA20: | 143.50 | |
| MA50: | 140.58 | |
| MA100: | 138.03 | |
| MAexp7: | 146.40 | |
| MAexp20: | 144.14 | |
| MAexp50: | 141.42 | |
| MAexp100: | 138.05 | |
| Price / MA7: | +2.17% | |
| Price / MA20: | +3.85% | |
| Price / MA50: | +6.00% | |
| Price / MA100: | +7.96% | |
| Price / MAexp7: | +1.79% | |
| Price / MAexp20: | +3.39% | |
| Price / MAexp50: | +5.37% | |
| Price / MAexp100: | +7.95% |
News
Don"t forget to follow the news on VALMONT INDUSTRIES INC.. At the time of publication of this analysis, the latest news was as follows:
- Valmont Board Declares Quarterly Dividend
- Valmont to Present at Baird 2019 Global Industrial Conference
- Valmont Announces Appointment of Richard "Rick" Lanoha to its Board of Directors
- Valmont Reports Third Quarter 2019 Results
- Valmont Industries, Inc. Announces Third Quarter 2019 Earnings Conference Call
About author

Online


Add a comment
Comments
0 comments on the analysis VALMONT INDUSTRIES INC. - Daily