| Open: | 0.000853 |
| Change: | -0.000018 |
| Volume: | 0 |
| Low: | 0.000832 |
| High: | 0.000868 |
| High / Low range: | 0.000036 |
| Type: | Stocks |
| Ticker: | UVV |
| ISIN: |
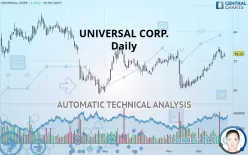
UNIVERSAL CORP. - Daily - Technical analysis published on 12/27/2019 (GMT)
- 166
- 0
- 12/27/2019 - 07:42
- Who voted?
Click here for a new analysis!
- Timeframe : Daily
- - Analysis generated on 12/27/2019 - 07:42
- Status : INVALID

Summary of the analysis

Additional analysis
Quotes
The UNIVERSAL CORP. price is 56.22 USD. The price registered an increase of +1.04% on the session with the lowest point at 55.69 USD and the highest point at 56.39 USD. The deviation from the price is +0.95% for the low point and -0.30% for the high point.A bullish gap was detected at the opening by the Central Gaps scanner. There are a lot of buyers and they have the upper hand in the very short term.
Opening Gap UP
Type : Bullish
Timeframe : Openning
A study of price movements over other periods shows the following variations:
Near a new HIGH record (1 month)
Type : Bullish
Timeframe : Weekly
Technical
Technical analysis of UNIVERSAL CORP. in Daily shows an overall bullish trend. 78.57% of the signals given by moving averages are bullish. The overall trend is reinforced by the strong bullish signals from short-term moving averages. The Central Indicators scanner detects a bullish signal on moving averages that could impact this trend:
Bullish price crossover with adaptative moving average 20
Type : Bullish
Timeframe : Daily
The probability of a further increase is high given the direction of the technical indicators.
But beware of excesses. The Central Indicators scanner currently detects this:
Williams %R indicator is overbought : over -20
Type : Neutral
Timeframe : Daily
Pivot points : price is over resistance 2
Type : Neutral
Timeframe : Daily
Price is back over the pivot point
Type : Bullish
Timeframe : Weekly
The analysis of the price chart with Central Patterns scanners does not return any result.
The Central Candlesticks scanner currently notes the presence of this pattern in Japanese candlesticks that could mark the end of the short-term trend currently underway:
Black hanging man / hammer
Type : Neutral
Timeframe : Daily
| S3 | S2 | S1 | Price | R1 | R2 | R3 | |
|---|---|---|---|---|---|---|---|
| ProTrendLines | 51.02 | 53.06 | 54.95 | 56.22 | 57.04 | 58.60 | 60.53 |
| Change (%) | -9.25% | -5.62% | -2.26% | - | +1.46% | +4.23% | +7.67% |
| Change | -5.20 | -3.16 | -1.27 | - | +0.82 | +2.38 | +4.31 |
| Level | Intermediate | Major | Intermediate | - | Major | Major | Minor |
Attention could also be paid to pivot points to set price objectives:
| Pivot points | S3 | S2 | S1 | PP | R1 | R2 | R3 |
|---|---|---|---|---|---|---|---|
| Standard | 54.85 | 55.06 | 55.35 | 55.56 | 55.85 | 56.06 | 56.35 |
| Camarilla | 55.50 | 55.55 | 55.59 | 55.64 | 55.69 | 55.73 | 55.78 |
| Woodie | 54.89 | 55.08 | 55.39 | 55.58 | 55.89 | 56.08 | 56.39 |
| Fibonacci | 55.06 | 55.25 | 55.37 | 55.56 | 55.75 | 55.87 | 56.06 |
| Pivot points | S3 | S2 | S1 | PP | R1 | R2 | R3 |
|---|---|---|---|---|---|---|---|
| Standard | 53.04 | 54.10 | 55.29 | 56.35 | 57.54 | 58.60 | 59.79 |
| Camarilla | 55.87 | 56.08 | 56.28 | 56.49 | 56.70 | 56.90 | 57.11 |
| Woodie | 53.12 | 54.13 | 55.37 | 56.38 | 57.62 | 58.63 | 59.87 |
| Fibonacci | 54.10 | 54.96 | 55.49 | 56.35 | 57.21 | 57.74 | 58.60 |
| Pivot points | S3 | S2 | S1 | PP | R1 | R2 | R3 |
|---|---|---|---|---|---|---|---|
| Standard | 42.56 | 46.36 | 49.27 | 53.07 | 55.98 | 59.78 | 62.69 |
| Camarilla | 50.34 | 50.95 | 51.57 | 52.18 | 52.80 | 53.41 | 54.03 |
| Woodie | 42.12 | 46.14 | 48.83 | 52.85 | 55.54 | 59.56 | 62.25 |
| Fibonacci | 46.36 | 48.92 | 50.51 | 53.07 | 55.63 | 57.22 | 59.78 |
Numerical data
The following is the status of technical indicators and moving averages registered at the time this technical analysis was created:
| RSI (14): | 63.66 | |
| MACD (12,26,9): | 0.8900 | |
| Directional Movement: | 15.19 | |
| AROON (14): | 78.57 | |
| DEMA (21): | 55.83 | |
| Parabolic SAR (0,02-0,02-0,2): | 55.27 | |
| Elder Ray (13): | 0.73 | |
| Super Trend (3,10): | 53.93 | |
| Zig ZAG (10): | 56.22 | |
| VORTEX (21): | 1.2200 | |
| Stochastique (14,3,5): | 67.30 | |
| TEMA (21): | 56.60 | |
| Williams %R (14): | -26.94 | |
| Chande Momentum Oscillator (20): | 2.63 | |
| Repulse (5,40,3): | -0.4400 | |
| ROCnROLL: | 1 | |
| TRIX (15,9): | 0.1800 | |
| Courbe Coppock: | 13.06 |
| MA7: | 56.18 | |
| MA20: | 54.37 | |
| MA50: | 53.86 | |
| MA100: | 53.32 | |
| MAexp7: | 55.85 | |
| MAexp20: | 54.80 | |
| MAexp50: | 54.08 | |
| MAexp100: | 54.11 | |
| Price / MA7: | +0.07% | |
| Price / MA20: | +3.40% | |
| Price / MA50: | +4.38% | |
| Price / MA100: | +5.44% | |
| Price / MAexp7: | +0.66% | |
| Price / MAexp20: | +2.59% | |
| Price / MAexp50: | +3.96% | |
| Price / MAexp100: | +3.90% |
About author

Online


Add a comment
Comments
0 comments on the analysis UNIVERSAL CORP. - Daily