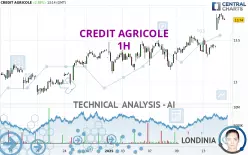
CREDIT AGRICOLE - 1H - Technical analysis published on 01/14/2025 (GMT)
- 86
- 0
Click here for a new analysis!
- Timeframe : 1H
- - Analysis generated on
- Status : LEVEL MAINTAINED

Summary of the analysis

Additional analysis
Quotes
The CREDIT AGRICOLE rating is 13.740 EUR. The price registered an increase of +2.39% on the session and was between 13.620 EUR and 13.820 EUR. This implies that the price is at +0.88% from its lowest and at -0.58% from its highest.The Central Gaps scanner detects the formation of a bullish gap marking the strong presence of buyers against sellers at the opening. This formed a quotation gap.
Opening Gap UP
Type : Bullish
Timeframe : Openning
Here is a more detailed summary of the historical variations registered by CREDIT AGRICOLE:
New HIGH record (1st january)
Type : Bullish
Timeframe : Weekly
New HIGH record (1 month)
Type : Bullish
Timeframe : Weekly
Technical
Technical analysis of CREDIT AGRICOLE in 1H shows a strongly overall bullish trend. 92.86% of the signals given by moving averages are bullish. The overall trend is supported by the strong bullish signals from short-term moving averages. There is no crossing of moving average by the price or crossing of moving averages between themselves.
In fact, 13 technical indicators on 18 studied are currently bullish. But beware of excesses. The Central Indicators scanner currently detects this:
CCI indicator is overbought : over 100
Type : Neutral
Timeframe : 1 hour
Williams %R indicator is overbought : over -20
Type : Neutral
Timeframe : 1 hour
Pivot points : price is over resistance 1
Type : Neutral
Timeframe : Weekly
Pivot points : price is over resistance 2
Type : Neutral
Timeframe : 1 hour
The Central Patterns scanner, which studies chart patterns, resistances and supports, has identified these signals:
Near horizontal resistance
Type : Bearish
Timeframe : 1 hour
Resistance of channel is broken
Type : Bullish
Timeframe : 1 hour
The Central Candlesticks scanner which studies Japanese candlesticks did not detect anything.
| S3 | S2 | S1 | Price | R1 | R2 | R3 | |
|---|---|---|---|---|---|---|---|
| ProTrendLines | 13.380 | 13.475 | 13.555 | 13.740 | 14.039 | 14.460 | 14.925 |
| Change (%) | -2.62% | -1.93% | -1.35% | - | +2.18% | +5.24% | +8.62% |
| Change | -0.360 | -0.265 | -0.185 | - | +0.299 | +0.720 | +1.185 |
| Level | Minor | Major | Intermediate | - | Intermediate | Minor | Major |
Pivot points can also be used to set your price objectives. Here is the price situation in relation to pivot points:
| Pivot points | S3 | S2 | S1 | PP | R1 | R2 | R3 |
|---|---|---|---|---|---|---|---|
| Standard | 13.080 | 13.190 | 13.305 | 13.415 | 13.530 | 13.640 | 13.755 |
| Camarilla | 13.358 | 13.379 | 13.399 | 13.420 | 13.441 | 13.461 | 13.482 |
| Woodie | 13.083 | 13.191 | 13.308 | 13.416 | 13.533 | 13.641 | 13.758 |
| Fibonacci | 13.190 | 13.276 | 13.329 | 13.415 | 13.501 | 13.554 | 13.640 |
| Pivot points | S3 | S2 | S1 | PP | R1 | R2 | R3 |
|---|---|---|---|---|---|---|---|
| Standard | 12.743 | 12.942 | 13.158 | 13.357 | 13.573 | 13.772 | 13.988 |
| Camarilla | 13.261 | 13.299 | 13.337 | 13.375 | 13.413 | 13.451 | 13.489 |
| Woodie | 12.753 | 12.946 | 13.168 | 13.361 | 13.583 | 13.776 | 13.998 |
| Fibonacci | 12.942 | 13.100 | 13.198 | 13.357 | 13.515 | 13.613 | 13.772 |
| Pivot points | S3 | S2 | S1 | PP | R1 | R2 | R3 |
|---|---|---|---|---|---|---|---|
| Standard | 11.607 | 11.983 | 12.637 | 13.013 | 13.667 | 14.043 | 14.697 |
| Camarilla | 13.007 | 13.101 | 13.196 | 13.290 | 13.384 | 13.479 | 13.573 |
| Woodie | 11.745 | 12.053 | 12.775 | 13.083 | 13.805 | 14.113 | 14.835 |
| Fibonacci | 11.983 | 12.377 | 12.620 | 13.013 | 13.407 | 13.650 | 14.043 |
Numerical data
The following is the status of technical indicators and moving averages registered at the time this technical analysis was created:
| RSI (14): | 67.43 | |
| MACD (12,26,9): | 0.0960 | |
| Directional Movement: | 25.408 | |
| AROON (14): | 64.285 | |
| DEMA (21): | 13.685 | |
| Parabolic SAR (0,02-0,02-0,2): | 13.396 | |
| Elder Ray (13): | 0.121 | |
| Super Trend (3,10): | 13.540 | |
| Zig ZAG (10): | 13.745 | |
| VORTEX (21): | 1.0470 | |
| Stochastique (14,3,5): | 88.78 | |
| TEMA (21): | 13.746 | |
| Williams %R (14): | -15.39 | |
| Chande Momentum Oscillator (20): | 0.405 | |
| Repulse (5,40,3): | -0.0050 | |
| ROCnROLL: | 1 | |
| TRIX (15,9): | 0.0610 | |
| Courbe Coppock: | 4.18 |
| MA7: | 13.440 | |
| MA20: | 13.248 | |
| MA50: | 13.195 | |
| MA100: | 13.604 | |
| MAexp7: | 13.704 | |
| MAexp20: | 13.577 | |
| MAexp50: | 13.469 | |
| MAexp100: | 13.370 | |
| Price / MA7: | +2.23% | |
| Price / MA20: | +3.71% | |
| Price / MA50: | +4.13% | |
| Price / MA100: | +1.00% | |
| Price / MAexp7: | +0.26% | |
| Price / MAexp20: | +1.20% | |
| Price / MAexp50: | +2.01% | |
| Price / MAexp100: | +2.77% |
News
The latest news and videos published on CREDIT AGRICOLE at the time of the analysis were as follows:
- Credit Agricole Sa: Crédit Agricole S.A. announces the reduction of its share capital through the cancellation of treasury shares purchased under a share repurchase program
- Credit Agricole Sa: Crédit Agricole S.A. has signed an agreement for the acquisition of Santander’s 30.5% stake in CACEIS, its asset services provider, aiming to bring its ownership to 100%
- CREDIT AGRICOLE SA: Olivier Gavalda appointed Chief Executive Officer of Crédit Agricole S.A.
- CREDIT AGRICOLE SA: Capital - Notification of the level of Pillar 2 additional requirement
- Credit Agricole Sa: Crédit Agricole entered into financial instruments relating to 5.2% of Banco BPM’s share capital
About author
Online


Add a comment
Comments
0 comments on the analysis CREDIT AGRICOLE - 1H