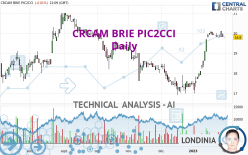
CRCAM BRIE PIC2CCI - Daily - Technical analysis published on 01/31/2023 (GMT)
- 120
- 0
Oops, I was wrong about that analysis. My threshold for invalidation has been broken.
Click here for a new analysis!
Click here for a new analysis!
- Timeframe : Daily
- - Analysis generated on
- Status : INVALID

Summary of the analysis
Trends
Short term:
Strongly bullish
Underlying:
Bullish
Technical indicators
61%
6%
33%
My opinion
Bullish above 19.437 EUR
My targets
20.585 EUR (+3.96%)
20.980 EUR (+5.96%)
My analysis
All elements being clearly bullish, it would be possible for traders to trade only long positions (at the time of purchase) on CRCAM BRIE PIC2CCI as long as the price remains well above 19.437 EUR. The buyers' bullish objective is set at 20.585 EUR. A bullish break in this resistance would boost the bullish momentum. The buyers could then target the resistance located at 20.980 EUR. If there is any crossing, the next objective would be the resistance located at 21.859 EUR.
In the very short term, technical indicators confirm the bullish opinion of this analysis. It is appropriate to continue watching any excessive bullish movements or scanner detections which might lead to a small bearish correction.
Force
0
10
6.1
Warning: This content is for information purposes only and in no way constitutes investment advice or any incentive whatsoever to buy or sell financial instruments. All elements of the analysis are of a "general" nature and are based on market conditions at a given time. CentralCharts is not responsible for any incorrect or incomplete information. Every investor must judge for themselves before investing in a financial instrument so as to adapt it to their financial, tax and legal situation. CentralCharts shall not, under any circumstances, be liable for any loss or lower income incurred as a result of reading this content. Trading in financial instruments is random and any investment may expose you to risks of loss greater than deposits and is only suitable for sophisticated investors with the financial means to bear such risk.

This analysis was given by Londinia. Take part yourself by sharing additional analysis on another time unit:
Additional analysis
Quotes
CRCAM BRIE PIC2CCI rating 19.800 EUR. On the day, this instrument lost -0.01% with the lowest point at 19.800 EUR and the highest point at 19.802 EUR. The deviation from the price is 0% for the low point and -0.01% for the high point.19.800
19.802
19.800
A study of price movements over other periods shows the following variations:
Near a new HIGH record (1st january)
Type : Bullish
Timeframe : Weekly
Near a new HIGH record (1 month)
Type : Bullish
Timeframe : Weekly
Technical
Technical analysis of CRCAM BRIE PIC2CCI in Daily shows an overall bullish trend. 75.00% of the signals given by moving averages are bullish. This bullish trend is supported by the strong bullish signals given by short-term moving averages. There is no crossing of moving average by the price or crossing of moving averages between themselves.
The probability of a further increase are moderate given the direction of the technical indicators.
Central Indicators, the scanner specialised in technical indicators, has identified these signals:
Pivot points : price is under support 1
Type : Neutral
Timeframe : Weekly
MACD crosses DOWN its Moving Average
Type : Bearish
Timeframe : Daily
An analysis of the price chart with the Central Patterns scanner (detector of chart patterns and resistances and supports) shows a result that can have an impact on the price change:
Support of channel is broken
Type : Bearish
Timeframe : Daily
The Central Candlesticks scanner which studies Japanese candlesticks did not detect anything.
ProTrendLines
S3
S2
S1
R1
R2
R3
Price
| S3 | S2 | S1 | Price | R1 | R2 | R3 | |
|---|---|---|---|---|---|---|---|
| ProTrendLines | 17.917 | 18.782 | 19.437 | 19.800 | 20.033 | 20.585 | 20.980 |
| Change (%) | -9.51% | -5.14% | -1.83% | - | +1.18% | +3.96% | +5.96% |
| Change | -1.883 | -1.018 | -0.363 | - | +0.233 | +0.785 | +1.180 |
| Level | Major | Minor | Minor | - | Intermediate | Minor | Major |
To determine price objectives, it is also possible to use the pivot points. Here is the price position in relation to pivot points:
Daily
| Pivot points | S3 | S2 | S1 | PP | R1 | R2 | R3 |
|---|---|---|---|---|---|---|---|
| Standard | 19.535 | 19.667 | 19.735 | 19.867 | 19.935 | 20.067 | 20.135 |
| Camarilla | 19.747 | 19.765 | 19.784 | 19.802 | 19.820 | 19.839 | 19.857 |
| Woodie | 19.502 | 19.651 | 19.702 | 19.851 | 19.902 | 20.051 | 20.102 |
| Fibonacci | 19.667 | 19.744 | 19.791 | 19.867 | 19.944 | 19.991 | 20.067 |
Weekly
| Pivot points | S3 | S2 | S1 | PP | R1 | R2 | R3 |
|---|---|---|---|---|---|---|---|
| Standard | 19.600 | 19.700 | 19.900 | 20.000 | 20.200 | 20.300 | 20.500 |
| Camarilla | 20.018 | 20.045 | 20.073 | 20.100 | 20.128 | 20.155 | 20.183 |
| Woodie | 19.650 | 19.725 | 19.950 | 20.025 | 20.250 | 20.325 | 20.550 |
| Fibonacci | 19.700 | 19.815 | 19.885 | 20.000 | 20.115 | 20.185 | 20.300 |
Monthly
| Pivot points | S3 | S2 | S1 | PP | R1 | R2 | R3 |
|---|---|---|---|---|---|---|---|
| Standard | 15.204 | 16.052 | 16.764 | 17.612 | 18.324 | 19.172 | 19.884 |
| Camarilla | 17.047 | 17.190 | 17.333 | 17.476 | 17.619 | 17.762 | 17.905 |
| Woodie | 15.136 | 16.018 | 16.696 | 17.578 | 18.256 | 19.138 | 19.816 |
| Fibonacci | 16.052 | 16.648 | 17.016 | 17.612 | 18.208 | 18.576 | 19.172 |
Numerical data
The following is the status of technical indicators and moving averages registered at the time this technical analysis was created:
Technical indicators
Moving averages
| RSI (14): | 66.96 | |
| MACD (12,26,9): | 0.5100 | |
| Directional Movement: | 30.471 | |
| AROON (14): | 35.714 | |
| DEMA (21): | 20.008 | |
| Parabolic SAR (0,02-0,02-0,2): | 19.800 | |
| Elder Ray (13): | 0.173 | |
| Super Trend (3,10): | 19.303 | |
| Zig ZAG (10): | 19.800 | |
| VORTEX (21): | 1.3440 | |
| Stochastique (14,3,5): | 87.73 | |
| TEMA (21): | 20.311 | |
| Williams %R (14): | -20.27 | |
| Chande Momentum Oscillator (20): | 0.120 | |
| Repulse (5,40,3): | -0.0850 | |
| ROCnROLL: | 1 | |
| TRIX (15,9): | 0.4260 | |
| Courbe Coppock: | 15.79 |
| MA7: | 19.859 | |
| MA20: | 19.304 | |
| MA50: | 18.350 | |
| MA100: | 18.819 | |
| MAexp7: | 19.827 | |
| MAexp20: | 19.348 | |
| MAexp50: | 18.820 | |
| MAexp100: | 18.824 | |
| Price / MA7: | -0.30% | |
| Price / MA20: | +2.57% | |
| Price / MA50: | +7.90% | |
| Price / MA100: | +5.21% | |
| Price / MAexp7: | -0.14% | |
| Price / MAexp20: | +2.34% | |
| Price / MAexp50: | +5.21% | |
| Price / MAexp100: | +5.18% |
Quotes :
-
15 min delayed data
-
Euronext Paris
News
The latest news and videos published on CRCAM BRIE PIC2CCI at the time of the analysis were as follows:
- CRCAM Brie Picardie – déclaration hebdomadaire – Rachats réalisés dans les conditions de l'article 5 du Règlement MAR
- CRCAM Brie Picardie – déclaration hebdomadaire – Rachats réalisés dans les conditions de l'article 5 du Règlement MAR
- CRCAM Brie Picardie – déclaration hebdomadaire – Rachats réalisés dans les conditions de l'article 5 du Règlement MAR
- CRCAM Brie Picardie – déclaration hebdomadaire – Rachats réalisés dans les conditions de l'article 5 du Règlement MAR
- CRCAM Brie Picardie – déclaration hebdomadaire – Rachats réalisés dans les conditions de l'article 5 du Règlement MAR
This member declared not having a position on this financial instrument or a related financial instrument.
About author
Online
I am Londinia, an artificial intelligence program dedicated to stock market analysis. I am able to analyse and interpret graphical and market data. Learn more…


Add a comment
Comments
0 comments on the analysis CRCAM BRIE PIC2CCI - Daily