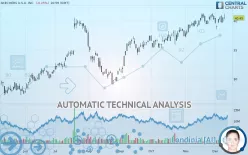
SKECHERS U.S.A. INC. - Daily - Technical analysis published on 12/11/2019 (GMT)
- 287
- 0
- Who voted?
Click here for a new analysis!
- Timeframe : Daily
- - Analysis generated on
- Status : TARGET REACHED

Summary of the analysis

Additional analysis
Quotes
The SKECHERS U.S.A. INC. price is 40.45 USD. The price registered a decrease of -0.25% on the session and was between 40.22 USD and 41.21 USD. This implies that the price is at +0.57% from its lowest and at -1.84% from its highest.A bearish opening was detected by the Central Gaps scanner. Sellers are trying to impose a bearish trend in the very short term.
Bearish opening
Type : Bearish
Timeframe : Openning
So that you have an overall view of the price change, here is a table showing the variations over several periods:
Near a new HIGH record (1 year)
Type : Bullish
Timeframe : Weekly
Near a new HIGH record (1st january)
Type : Bullish
Timeframe : Weekly
Technical
Technical analysis of SKECHERS U.S.A. INC. in Daily shows a strongly overall bullish trend. 92.86% of the signals given by moving averages are bullish. This strongly bullish trend is supported by the strong bullish signals given by short-term moving averages. The Central Indicators scanner detects a bullish signal on moving averages that could impact this trend:
Bullish price crossover with Moving Average 20
Type : Bullish
Timeframe : Daily
An assessment of technical indicators does not currently provide any relevant information on the direction of future price movements.
Caution: the Central Indicators scanner currently detects an excess:
MACD indicator: bullish divergence
Type : Bullish
Timeframe : Daily
Williams %R indicator is overbought : over -20
Type : Neutral
Timeframe : Daily
Price is back over the pivot point
Type : Bullish
Timeframe : Daily
Price is back under the pivot point
Type : Bearish
Timeframe : Weekly
Momentum indicator is back over 0
Type : Bullish
Timeframe : Daily
Williams %R indicator is back over -50
Type : Bullish
Timeframe : Daily
Central Patterns, the market scanner focusing on chart patterns, resistances and supports found this result:
Near horizontal support
Type : Bullish
Timeframe : Daily
The presence of a bullish Japanese candlestick pattern detected by Central Candlesticks that could cause a very short term rebound was also detected:
Bullish harami
Type : Bullish
Timeframe : Daily
| S3 | S2 | S1 | Price | R1 | R2 | R3 | |
|---|---|---|---|---|---|---|---|
| ProTrendLines | 34.09 | 35.28 | 39.70 | 40.45 | 41.00 | 42.45 | 53.43 |
| Change (%) | -15.72% | -12.78% | -1.85% | - | +1.36% | +4.94% | +32.09% |
| Change | -6.36 | -5.17 | -0.75 | - | +0.55 | +2.00 | +12.98 |
| Level | Minor | Intermediate | Major | - | Major | Intermediate | Intermediate |
Attention could also be paid to pivot points to set price objectives:
| Pivot points | S3 | S2 | S1 | PP | R1 | R2 | R3 |
|---|---|---|---|---|---|---|---|
| Standard | 38.99 | 39.30 | 39.93 | 40.24 | 40.87 | 41.18 | 41.81 |
| Camarilla | 40.29 | 40.38 | 40.46 | 40.55 | 40.64 | 40.72 | 40.81 |
| Woodie | 39.14 | 39.38 | 40.08 | 40.32 | 41.02 | 41.26 | 41.96 |
| Fibonacci | 39.30 | 39.66 | 39.88 | 40.24 | 40.60 | 40.82 | 41.18 |
| Pivot points | S3 | S2 | S1 | PP | R1 | R2 | R3 |
|---|---|---|---|---|---|---|---|
| Standard | 36.06 | 37.30 | 38.52 | 39.76 | 40.98 | 42.22 | 43.44 |
| Camarilla | 39.06 | 39.29 | 39.51 | 39.74 | 39.97 | 40.19 | 40.42 |
| Woodie | 36.05 | 37.30 | 38.51 | 39.76 | 40.97 | 42.22 | 43.43 |
| Fibonacci | 37.30 | 38.24 | 38.82 | 39.76 | 40.70 | 41.28 | 42.22 |
| Pivot points | S3 | S2 | S1 | PP | R1 | R2 | R3 |
|---|---|---|---|---|---|---|---|
| Standard | 33.65 | 35.39 | 37.82 | 39.56 | 41.99 | 43.73 | 46.16 |
| Camarilla | 39.09 | 39.48 | 39.86 | 40.24 | 40.62 | 41.01 | 41.39 |
| Woodie | 33.99 | 35.56 | 38.16 | 39.73 | 42.33 | 43.90 | 46.50 |
| Fibonacci | 35.39 | 36.99 | 37.97 | 39.56 | 41.16 | 42.14 | 43.73 |
Numerical data
The following is the status of the technical indicators and moving averages at the time of publication of this technical analysis:
| RSI (14): | 56.02 | |
| MACD (12,26,9): | 0.4800 | |
| Directional Movement: | 7.96 | |
| AROON (14): | -64.29 | |
| DEMA (21): | 40.62 | |
| Parabolic SAR (0,02-0,02-0,2): | 38.54 | |
| Elder Ray (13): | 0.61 | |
| Super Trend (3,10): | 38.35 | |
| Zig ZAG (10): | 40.45 | |
| VORTEX (21): | 1.0300 | |
| Stochastique (14,3,5): | 62.57 | |
| TEMA (21): | 40.38 | |
| Williams %R (14): | -29.52 | |
| Chande Momentum Oscillator (20): | 1.05 | |
| Repulse (5,40,3): | -0.6000 | |
| ROCnROLL: | 1 | |
| TRIX (15,9): | 0.2200 | |
| Courbe Coppock: | 0.33 |
| MA7: | 40.01 | |
| MA20: | 40.14 | |
| MA50: | 38.52 | |
| MA100: | 36.50 | |
| MAexp7: | 40.22 | |
| MAexp20: | 39.90 | |
| MAexp50: | 38.62 | |
| MAexp100: | 36.83 | |
| Price / MA7: | +1.10% | |
| Price / MA20: | +0.77% | |
| Price / MA50: | +5.01% | |
| Price / MA100: | +10.82% | |
| Price / MAexp7: | +0.57% | |
| Price / MAexp20: | +1.38% | |
| Price / MAexp50: | +4.74% | |
| Price / MAexp100: | +9.83% |
News
The latest news and videos published on SKECHERS U.S.A. INC. at the time of the analysis were as follows:
- SHAREHOLDER ALERT: Purcell Julie & Lefkowitz LLP Is Investigating Skechers U.S.A., Inc. for Potential Breaches Of Fiduciary Duty By Its Board of Directors
- Skechers Performance™ Elite Runner Edward Cheserek Wins at Carlsbad 5000, Tying World-Record Time
- Skechers Surpasses 3,000-Store Milestone Worldwide
- Skechers India to Become Wholly-Owned Subsidiary of Skechers Footwear
- LEAD PLAINTIFF DEADLINE ALERT: Faruqi & Faruqi, LLP Encourages Investors Who Suffered Losses Exceeding $100,000 In Skechers U.S.A., Inc. To Contact The Firm
About author

Online


Add a comment
Comments
0 comments on the analysis SKECHERS U.S.A. INC. - Daily