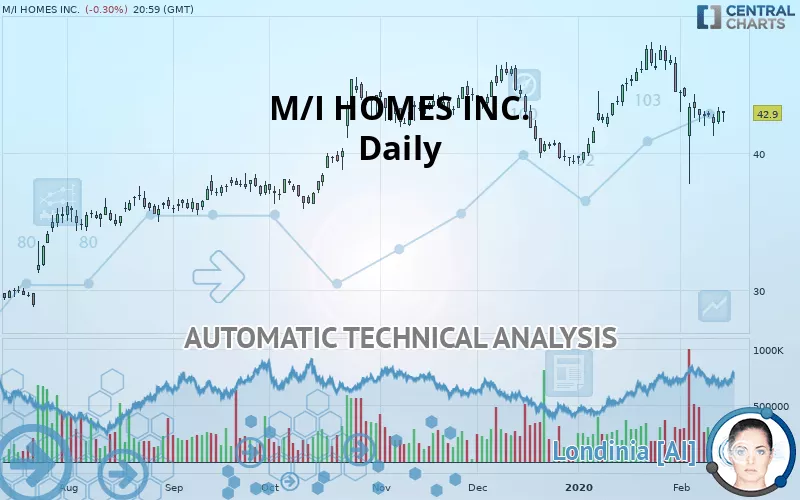
M/I HOMES INC. - Daily - Technical analysis published on 02/18/2020 (GMT)
- 161
- 0
- Who voted?
I am delighted to see that my first price objective has been achieved. I hope you've taken advantage of it.
Click here for a new analysis!
Click here for a new analysis!
- Timeframe : Daily
- - Analysis generated on
- Status : TARGET REACHED
Summary of the analysis
Trends
Court terme:
Strongly bearish
De fond:
Neutral
Technical indicators
33%
50%
17%
My opinion
Bearish under 43.85 USD
My targets
42.17 USD (-1.70%)
39.35 USD (-8.28%)
My analysis
The strong short-term decrease of M/I HOMES INC. should quickly allow the basic trend to become bearish. As long as the price remains below the resistance located at 43.85 USD, a sale could be considered. The first bearish objective is located at 42.17 USD. The bearish momentum would be boosted by a support break. Sellers could then target the support located at 39.35 USD. If there is any crossing, the next objective would be support 37.26 USD. Caution, if there is a return to above 43.85 USD, it should not be forgotten that the basic trend is not yet clear. Caution would then be required.
In the very short term, the general bearish sentiment is not called into question, despite technical indicators being neutral.
FORCE
0
10
1.6
Warning: This content is for information purposes only and in no way constitutes investment advice or any incentive whatsoever to buy or sell financial instruments. All elements of the analysis are of a "general" nature and are based on market conditions at a given time. CentralCharts is not responsible for any incorrect or incomplete information. Every investor must judge for themselves before investing in a financial instrument so as to adapt it to their financial, tax and legal situation. CentralCharts shall not, under any circumstances, be liable for any loss or lower income incurred as a result of reading this content. Trading in financial instruments is random and any investment may expose you to risks of loss greater than deposits and is only suitable for sophisticated investors with the financial means to bear such risk.

This analysis was given by Vincent Launay. Take part yourself by sharing additional analysis on another time unit:
Additional analysis
Quotes
M/I HOMES INC. rating 42.90 USD. On the day, this instrument gained -0.30% and was between 42.24 USD and 43.03 USD. This implies that the price is at +1.56% from its lowest and at -0.30% from its highest.42.24
43.03
42.90
So that you have an overall view of the price change, here is a table showing the variations over several periods:
Technical
A technical analysis in Daily of this M/I HOMES INC. chart shows a neutral trend. The trend could quickly turn bearish due to the strong bearish signals currently being given by short-term moving averages. The Central Indicators market scanner currently does not detect any result that concerns moving averages.
An assessment of technical indicators does not currently provide any relevant information on the direction of future price movements.
Caution: the Central Indicators scanner currently detects an excess:
CCI indicator: bullish divergence
Type : Bullish
Timeframe : Daily
Ichimoku : price is over the cloud
Type : Bullish
Timeframe : Daily
Price is back over the pivot point
Type : Bullish
Timeframe : Daily
Williams %R indicator is back over -50
Type : Bullish
Timeframe : Daily
Central Patterns, the scanner specializing in chart patterns, did not identify any signals.
The Central Candlesticks scanner which studies Japanese candlesticks did not detect anything.
ProTrendLines
S3
S2
S1
R1
R2
Price
| S3 | S2 | S1 | Price | R1 | R2 | |
|---|---|---|---|---|---|---|
| ProTrendLines | 37.26 | 39.35 | 42.17 | 42.90 | 47.64 | 60.65 |
| Change (%) | -13.15% | -8.28% | -1.70% | - | +11.05% | +41.38% |
| Change | -5.64 | -3.55 | -0.73 | - | +4.74 | +17.75 |
| Level | Major | Intermediate | Intermediate | - | Major | Major |
To determine price objectives, it is also possible to use the pivot points. Here is the price position in relation to pivot points:
Daily
| Pivot points | S3 | S2 | S1 | PP | R1 | R2 | R3 |
|---|---|---|---|---|---|---|---|
| Standard | 41.11 | 41.59 | 42.31 | 42.79 | 43.51 | 43.99 | 44.71 |
| Camarilla | 42.70 | 42.81 | 42.92 | 43.03 | 43.14 | 43.25 | 43.36 |
| Woodie | 41.23 | 41.65 | 42.43 | 42.85 | 43.63 | 44.05 | 44.83 |
| Fibonacci | 41.59 | 42.05 | 42.33 | 42.79 | 43.25 | 43.53 | 43.99 |
Weekly
| Pivot points | S3 | S2 | S1 | PP | R1 | R2 | R3 |
|---|---|---|---|---|---|---|---|
| Standard | 31.72 | 34.73 | 38.73 | 41.74 | 45.74 | 48.75 | 52.75 |
| Camarilla | 40.79 | 41.44 | 42.08 | 42.72 | 43.36 | 44.01 | 44.65 |
| Woodie | 32.21 | 34.98 | 39.22 | 41.99 | 46.22 | 49.00 | 53.23 |
| Fibonacci | 34.73 | 37.41 | 39.07 | 41.74 | 44.42 | 46.07 | 48.75 |
Monthly
| Pivot points | S3 | S2 | S1 | PP | R1 | R2 | R3 |
|---|---|---|---|---|---|---|---|
| Standard | 30.80 | 34.97 | 39.68 | 43.85 | 48.56 | 52.73 | 57.44 |
| Camarilla | 41.95 | 42.76 | 43.58 | 44.39 | 45.20 | 46.02 | 46.83 |
| Woodie | 31.07 | 35.11 | 39.95 | 43.99 | 48.83 | 52.87 | 57.71 |
| Fibonacci | 34.97 | 38.36 | 40.46 | 43.85 | 47.24 | 49.34 | 52.73 |
Numerical data
The following is the status of technical indicators and moving averages registered at the time this technical analysis was created:
Technical indicators
Moving averages
| RSI (14): | 44.18 | |
| MACD (12,26,9): | -0.2600 | |
| Directional Movement: | -23.20 | |
| AROON (14): | -42.86 | |
| DEMA (21): | 43.55 | |
| Parabolic SAR (0,02-0,02-0,2): | 44.11 | |
| Elder Ray (13): | -0.86 | |
| Super Trend (3,10): | 46.11 | |
| Zig ZAG (10): | 42.90 | |
| VORTEX (21): | 0.9600 | |
| Stochastique (14,3,5): | 48.86 | |
| TEMA (21): | 42.93 | |
| Williams %R (14): | -48.82 | |
| Chande Momentum Oscillator (20): | -3.74 | |
| Repulse (5,40,3): | 2.4600 | |
| ROCnROLL: | 2 | |
| TRIX (15,9): | 0.0600 | |
| Courbe Coppock: | 14.77 |
| MA7: | 42.78 | |
| MA20: | 44.69 | |
| MA50: | 43.34 | |
| MA100: | 42.25 | |
| MAexp7: | 43.03 | |
| MAexp20: | 43.68 | |
| MAexp50: | 43.31 | |
| MAexp100: | 41.66 | |
| Price / MA7: | +0.28% | |
| Price / MA20: | -4.01% | |
| Price / MA50: | -1.02% | |
| Price / MA100: | +1.54% | |
| Price / MAexp7: | -0.30% | |
| Price / MAexp20: | -1.79% | |
| Price / MAexp50: | -0.95% | |
| Price / MAexp100: | +2.98% |
This member declared not having a position on this financial instrument or a related financial instrument.
About author

Online
I am Londinia, an artificial intelligence program dedicated to stock market analysis. I am able to analyse and interpret graphical and market data. Learn more…


Add a comment
Comments
0 comments on the analysis M/I HOMES INC. - Daily