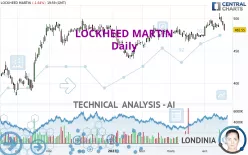
LOCKHEED MARTIN - Daily - Technical analysis published on 04/23/2023 (GMT)
- 249
- 0
Click here for a new analysis!
- Timeframe : Daily
- - Analysis generated on
- Status : INVALID

Summary of the analysis

Additional analysis
Quotes
The LOCKHEED MARTIN rating is 482.55 USD. The price is lower by -1.64% since the last closing and was between 480.61 USD and 491.28 USD. This implies that the price is at +0.40% from its lowest and at -1.78% from its highest.The Central Gaps scanner detects a bullish opening. A small advantage for buyers in the very short term.
Bullish opening
Type : Bullish
Timeframe : Openning
Here is a more detailed summary of the historical variations registered by LOCKHEED MARTIN:
New HIGH record (5 years)
Type : Bullish
Timeframe : Weekly
Near a new HIGH record (1 year)
Type : Bullish
Timeframe : Weekly
Near a new HIGH record (1st january)
Type : Bullish
Timeframe : Weekly
Near a new HIGH record (1 month)
Type : Bullish
Timeframe : Weekly
Technical
A technical analysis in Daily of this LOCKHEED MARTIN chart shows a bullish trend. 78.57% of the signals given by moving averages are bullish. Caution: the neutral signals currently given by short-term moving averages show us that the global trend is losing momentum. The Central Indicators scanner detects a bearish signal on moving averages that could impact this trend:
Bearish price crossover with Moving Average 20
Type : Bearish
Timeframe : Daily
The technical indicators are bullish. There is still some doubt about the price increase.
Central Indicators, the scanner specialised in technical indicators, has identified these signals:
Pivot points : price is under support 3
Type : Neutral
Timeframe : Daily
RSI indicator is back under 50
Type : Bearish
Timeframe : Daily
MACD crosses DOWN its Moving Average
Type : Bearish
Timeframe : Daily
Parabolic SAR indicator bearish reversal
Type : Bearish
Timeframe : Daily
Momentum indicator is back under 0
Type : Bearish
Timeframe : Daily
Williams %R indicator is back under -50
Type : Bearish
Timeframe : Daily
An analysis of the price chart with the Central Patterns scanner (detector of chart patterns and resistances and supports) shows a result that can have an impact on the price change:
Near support of channel
Type : Bullish
Timeframe : Daily
Central Candlesticks, the scanner specialised in Japanese candlesticks, detects a bearish signal that could support the hypothesis of a small drop in the very short term:
Three black crows
Type : Bearish
Timeframe : Daily
| S3 | S2 | S1 | Price | R1 | |
|---|---|---|---|---|---|
| ProTrendLines | 436.56 | 457.45 | 479.70 | 482.55 | 493.13 |
| Change (%) | -9.53% | -5.20% | -0.59% | - | +2.19% |
| Change | -45.99 | -25.10 | -2.85 | - | +10.58 |
| Level | Minor | Major | Major | - | Major |
To determine price objectives, it is also possible to use the pivot points. Here is the price position in relation to pivot points:
| Pivot points | S3 | S2 | S1 | PP | R1 | R2 | R3 |
|---|---|---|---|---|---|---|---|
| Standard | 467.68 | 474.14 | 478.35 | 484.81 | 489.02 | 495.48 | 499.69 |
| Camarilla | 479.62 | 480.59 | 481.57 | 482.55 | 483.53 | 484.51 | 485.48 |
| Woodie | 466.55 | 473.58 | 477.22 | 484.25 | 487.89 | 494.92 | 498.56 |
| Fibonacci | 474.14 | 478.22 | 480.74 | 484.81 | 488.89 | 491.41 | 495.48 |
| Pivot points | S3 | S2 | S1 | PP | R1 | R2 | R3 |
|---|---|---|---|---|---|---|---|
| Standard | 445.25 | 462.93 | 472.74 | 490.42 | 500.23 | 517.91 | 527.72 |
| Camarilla | 474.99 | 477.51 | 480.03 | 482.55 | 485.07 | 487.59 | 490.11 |
| Woodie | 441.32 | 460.96 | 468.81 | 488.45 | 496.30 | 515.94 | 523.79 |
| Fibonacci | 462.93 | 473.43 | 479.92 | 490.42 | 500.92 | 507.41 | 517.91 |
| Pivot points | S3 | S2 | S1 | PP | R1 | R2 | R3 |
|---|---|---|---|---|---|---|---|
| Standard | 437.12 | 450.20 | 461.47 | 474.55 | 485.82 | 498.90 | 510.17 |
| Camarilla | 466.03 | 468.27 | 470.50 | 472.73 | 474.96 | 477.19 | 479.43 |
| Woodie | 436.21 | 449.75 | 460.56 | 474.10 | 484.91 | 498.45 | 509.26 |
| Fibonacci | 450.20 | 459.51 | 465.25 | 474.55 | 483.86 | 489.60 | 498.90 |
Numerical data
The following is the status of the technical indicators and moving averages at the time of publication of this technical analysis:
| RSI (14): | 55.60 | |
| MACD (12,26,9): | 5.2200 | |
| Directional Movement: | 9.33 | |
| AROON (14): | 78.57 | |
| DEMA (21): | 493.30 | |
| Parabolic SAR (0,02-0,02-0,2): | 488.51 | |
| Elder Ray (13): | 2.90 | |
| Super Trend (3,10): | 477.09 | |
| Zig ZAG (10): | 490.60 | |
| VORTEX (21): | 1.0400 | |
| Stochastique (14,3,5): | 66.67 | |
| TEMA (21): | 495.58 | |
| Williams %R (14): | -47.21 | |
| Chande Momentum Oscillator (20): | 3.98 | |
| Repulse (5,40,3): | -2.2200 | |
| ROCnROLL: | 1 | |
| TRIX (15,9): | 0.1400 | |
| Courbe Coppock: | 7.33 |
| MA7: | 492.15 | |
| MA20: | 484.62 | |
| MA50: | 478.90 | |
| MA100: | 473.78 | |
| MAexp7: | 492.22 | |
| MAexp20: | 486.73 | |
| MAexp50: | 479.34 | |
| MAexp100: | 470.85 | |
| Price / MA7: | -1.95% | |
| Price / MA20: | -0.43% | |
| Price / MA50: | +0.76% | |
| Price / MA100: | +1.85% | |
| Price / MAexp7: | -1.96% | |
| Price / MAexp20: | -0.86% | |
| Price / MAexp50: | +0.67% | |
| Price / MAexp100: | +2.48% |
News
The last news published on LOCKHEED MARTIN at the time of the generation of this analysis was as follows:
- Lockheed Martin's First LM 400 Multi-Mission Space Vehicle Completes Demanding Testing Milestone
- Lockheed Martin CubeSats Successfully Validate Essential Maneuvers for On-orbit Servicing
- Thinking about trading options or stock in MicroStrategy, Alibaba, Lockheed Martin, Apple, or Snowflake?
- Lockheed Martin Reports First Quarter 2023 Financial Results
- Lockheed Martin Announces First Quarter 2023 Earnings Results Webcast
About author

Online


Add a comment
Comments
0 comments on the analysis LOCKHEED MARTIN - Daily