LOCKHEED MARTIN - 1H - Technical analysis published on 09/06/2024 (GMT)
- 187
- 0
Click here for a new analysis!
- Timeframe : 1H
- - Analysis generated on
- Status : TARGET REACHED
Summary of the analysis

Additional analysis
Quotes
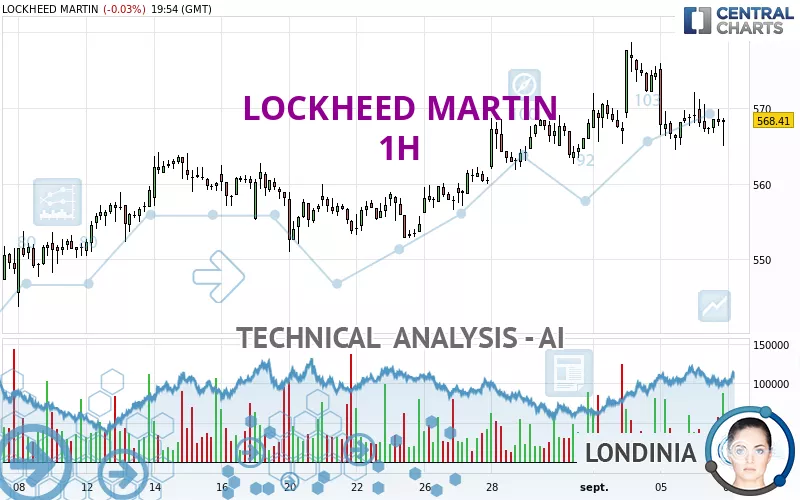
The LOCKHEED MARTIN rating is 568.17 USD. The price is lower by -0.07% since the last closing with the lowest point at 564.95 USD and the highest point at 572.11 USD. The deviation from the price is +0.57% for the low point and -0.69% for the high point.The Central Gaps scanner detects a bullish opening marking the presence of buyers ahead of sellers at the opening but not sufficiently marked to allow the price to register a quotation gap.
Bullish opening
Type : Bullish
Timeframe : Openning
So that you have an overall view of the price change, here is a table showing the variations over several periods:
New HIGH record (5 years)
Type : Bullish
Timeframe : Weekly
Near a new HIGH record (1 year)
Type : Bullish
Timeframe : Weekly
Near a new HIGH record (1st january)
Type : Bullish
Timeframe : Weekly
Near a new HIGH record (1 month)
Type : Bullish
Timeframe : Weekly
Technical
Technical analysis of this 1H chart of LOCKHEED MARTIN indicates that the overall trend is bullish. 64.29% of the signals given by moving averages are bullish. Caution: the neutral signals currently given by short-term moving averages show us that the global trend is losing momentum. The Central Indicators scanner detects bearish signals on moving averages that could impact this trend:
Bearish price crossover with Moving Average 50
Type : Bearish
Timeframe : 1 hour
Bearish price crossover with adaptative moving average 20
Type : Bearish
Timeframe : 1 hour
Bearish price crossover with adaptative moving average 50
Type : Bearish
Timeframe : 1 hour
On the 18 technical indicators analysed, 4 are bullish, 6 are neutral and 8 are bearish. But beware of excesses. The Central Indicators scanner currently detects this:
Williams %R indicator is oversold : under -80
Type : Neutral
Timeframe : 1 hour
RSI indicator is back under 50
Type : Bearish
Timeframe : 1 hour
Momentum indicator is back under 0
Type : Bearish
Timeframe : 1 hour
Central Patterns, the market scanner focusing on chart patterns, resistances and supports found these results:
Near horizontal resistance
Type : Bearish
Timeframe : 1 hour
Near support of channel
Type : Bullish
Timeframe : 1 hour
The Central Candlesticks scanner which studies Japanese candlesticks did not detect anything.
| S3 | S2 | S1 | Price | R1 | R2 | |
|---|---|---|---|---|---|---|
| ProTrendLines | 544.10 | 550.20 | 560.10 | 568.17 | 572.00 | 578.73 |
| Change (%) | -4.24% | -3.16% | -1.42% | - | +0.67% | +1.86% |
| Change | -24.07 | -17.97 | -8.07 | - | +3.83 | +10.56 |
| Level | Minor | Intermediate | Major | - | Minor | Major |
To determine price objectives, it is also possible to use the pivot points. Here is the price position in relation to pivot points:
| Pivot points | S3 | S2 | S1 | PP | R1 | R2 | R3 |
|---|---|---|---|---|---|---|---|
| Standard | 551.85 | 558.13 | 563.36 | 569.64 | 574.87 | 581.15 | 586.38 |
| Camarilla | 565.43 | 566.48 | 567.54 | 568.59 | 569.65 | 570.70 | 571.76 |
| Woodie | 551.33 | 557.87 | 562.84 | 569.38 | 574.35 | 580.89 | 585.86 |
| Fibonacci | 558.13 | 562.53 | 565.24 | 569.64 | 574.04 | 576.75 | 581.15 |
| Pivot points | S3 | S2 | S1 | PP | R1 | R2 | R3 |
|---|---|---|---|---|---|---|---|
| Standard | 543.78 | 548.40 | 556.68 | 561.30 | 569.58 | 574.20 | 582.48 |
| Camarilla | 561.40 | 562.59 | 563.77 | 564.95 | 566.13 | 567.32 | 568.50 |
| Woodie | 545.60 | 549.32 | 558.50 | 562.22 | 571.40 | 575.12 | 584.30 |
| Fibonacci | 548.40 | 553.33 | 556.38 | 561.30 | 566.23 | 569.28 | 574.20 |
| Pivot points | S3 | S2 | S1 | PP | R1 | R2 | R3 |
|---|---|---|---|---|---|---|---|
| Standard | 511.66 | 522.71 | 543.83 | 554.88 | 576.00 | 587.05 | 608.17 |
| Camarilla | 556.10 | 559.05 | 562.00 | 564.95 | 567.90 | 570.85 | 573.80 |
| Woodie | 516.70 | 525.23 | 548.87 | 557.40 | 581.04 | 589.57 | 613.21 |
| Fibonacci | 522.71 | 535.00 | 542.59 | 554.88 | 567.17 | 574.76 | 587.05 |
Numerical data
The following is the status of the technical indicators and moving averages at the time of publication of this technical analysis:
| RSI (14): | 42.62 | |
| MACD (12,26,9): | -0.0200 | |
| Directional Movement: | 0.20 | |
| AROON (14): | -21.43 | |
| DEMA (21): | 568.62 | |
| Parabolic SAR (0,02-0,02-0,2): | 570.00 | |
| Elder Ray (13): | -1.43 | |
| Super Trend (3,10): | 575.38 | |
| Zig ZAG (10): | 565.49 | |
| VORTEX (21): | 0.9700 | |
| Stochastique (14,3,5): | 27.25 | |
| TEMA (21): | 567.21 | |
| Williams %R (14): | -84.27 | |
| Chande Momentum Oscillator (20): | -1.72 | |
| Repulse (5,40,3): | -0.4300 | |
| ROCnROLL: | -1 | |
| TRIX (15,9): | 0.0200 | |
| Courbe Coppock: | 1.62 |
| MA7: | 566.78 | |
| MA20: | 558.80 | |
| MA50: | 519.68 | |
| MA100: | 489.64 | |
| MAexp7: | 567.96 | |
| MAexp20: | 568.19 | |
| MAexp50: | 565.98 | |
| MAexp100: | 560.66 | |
| Price / MA7: | +0.25% | |
| Price / MA20: | +1.68% | |
| Price / MA50: | +9.33% | |
| Price / MA100: | +16.04% | |
| Price / MAexp7: | +0.04% | |
| Price / MAexp20: | +0.00% | |
| Price / MAexp50: | +0.39% | |
| Price / MAexp100: | +1.34% |
News
The latest news and videos published on LOCKHEED MARTIN at the time of the analysis were as follows:
- Lockheed Martin Welcomes Egypt to the C-130J Super Hercules Fleet
- Lockheed Martin Chairman, President and CEO and CFO to Speak at the Morgan Stanley Conference
- Poland and Lockheed Martin Celebrate Debut of Poland's First F-35A "Husarz"
- Lockheed Martin to Acquire Terran Orbital
- Global Super Hercules Fleet Grows with Delivery of First C-130J to New Zealand
About author
Online


Add a comment
Comments
0 comments on the analysis LOCKHEED MARTIN - 1H