COSTCO WHOLESALE Technical Analyses - Page 3
COSTCO WHOLESALE - More technical analyses...
- 0
- 89287
- 15474
- 0

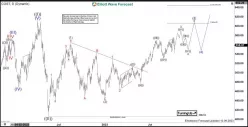
Status : TARGET REACHED
Simple chart
- 134
- 0
- 0
- 16
- 343
- 52
- 0

Simple chart
- 137
- 0
- 0
- 19
- 823
- 478
- 0
Simple chart
- 163
- 0
- 1
- 16
- 343
- 52
- 0
Simple chart
- 225
- 0
- 0
- 19
- 823
- 478
- 0

Simple chart
- 160
- 0
- 1
- 16
- 343
- 52
- 0
Simple chart
- 229
- 0
- 0
- 0
- 89287
- 15474
- 0
Status : INVALID
Simple chart
- 232
- 0
- 0
- 0
- 89287
- 15474
- 0
Status : TARGET REACHED
Simple chart
- 260
- 0
- 0
- 0
- 89287
- 15474
- 0

Status : TARGET REACHED
Simple chart
- 165
- 0
- 0
- 0
- 89287
- 15474
- 0
Status : LEVEL MAINTAINED
Simple chart
- 275
- 0
- 0
- 0
- 89287
- 15474
- 0

Status : INVALID
Simple chart
- 231
- 0
- 0
- 0
- 89287
- 15474
- 0

Status : LEVEL MAINTAINED
Simple chart
- 346
- 0
- 1

