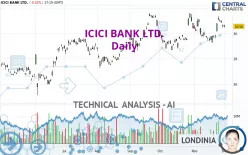
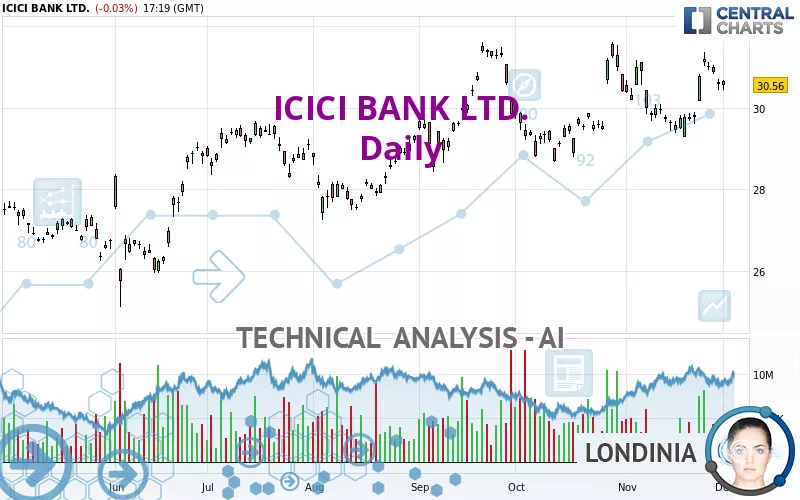
ICICI BANK LTD. - Daily - Technical analysis published on 12/02/2024 (GMT)
- 142
- 0
Click here for a new analysis!
- Timeframe : Daily
- - Analysis generated on
- Status : TARGET REACHED
Summary of the analysis

Additional analysis
Quotes
ICICI BANK LTD. rating 30.56 USD. On the day, this instrument lost -0.03% and was between 30.42 USD and 30.67 USD. This implies that the price is at +0.46% from its lowest and at -0.36% from its highest.So that you have an overall view of the price change, here is a table showing the variations over several periods:
Near a new HIGH record (5 years)
Type : Bullish
Timeframe : Weekly
Near a new HIGH record (1 year)
Type : Bullish
Timeframe : Weekly
Near a new HIGH record (1st january)
Type : Bullish
Timeframe : Weekly
Near a new LOW record (1 month)
Type : Bearish
Timeframe : Weekly
Technical
A technical analysis in Daily of this ICICI BANK LTD. chart shows a strongly bullish trend. 85.71% of the signals given by moving averages are bullish. The overall trend is supported by the strong bullish signals from short-term moving averages. An assessment of moving averages reveals several bearish and bullish signals:
Bullish trend reversal : Moving Average 20
Type : Bullish
Timeframe : Daily
Bearish trend reversal : Moving Average 50
Type : Bearish
Timeframe : Daily
The probability of a further increase are moderate given the direction of the technical indicators.
The Central Indicators scanner found no further results concerning independent technical indicators.
Central Patterns, the market scanner focusing on chart patterns, resistances and supports found this result:
Near horizontal resistance
Type : Bearish
Timeframe : Daily
The Central Candlesticks scanner which studies Japanese candlesticks did not detect anything.
| S3 | S2 | S1 | Price | R1 | |
|---|---|---|---|---|---|
| ProTrendLines | 27.55 | 28.70 | 29.37 | 30.56 | 31.38 |
| Change (%) | -9.85% | -6.09% | -3.89% | - | +2.68% |
| Change | -3.01 | -1.86 | -1.19 | - | +0.82 |
| Level | Minor | Intermediate | Intermediate | - | Major |
To determine price objectives, it is also possible to use the pivot points. Here is the price position in relation to pivot points:
| Pivot points | S3 | S2 | S1 | PP | R1 | R2 | R3 |
|---|---|---|---|---|---|---|---|
| Standard | 30.16 | 30.29 | 30.43 | 30.56 | 30.70 | 30.83 | 30.97 |
| Camarilla | 30.50 | 30.52 | 30.55 | 30.57 | 30.60 | 30.62 | 30.64 |
| Woodie | 30.17 | 30.29 | 30.44 | 30.56 | 30.71 | 30.83 | 30.98 |
| Fibonacci | 30.29 | 30.39 | 30.46 | 30.56 | 30.66 | 30.73 | 30.83 |
| Pivot points | S3 | S2 | S1 | PP | R1 | R2 | R3 |
|---|---|---|---|---|---|---|---|
| Standard | 29.28 | 29.85 | 30.21 | 30.78 | 31.14 | 31.71 | 32.07 |
| Camarilla | 30.31 | 30.40 | 30.49 | 30.57 | 30.66 | 30.74 | 30.83 |
| Woodie | 29.18 | 29.80 | 30.11 | 30.73 | 31.04 | 31.66 | 31.97 |
| Fibonacci | 29.85 | 30.21 | 30.43 | 30.78 | 31.14 | 31.36 | 31.71 |
| Pivot points | S3 | S2 | S1 | PP | R1 | R2 | R3 |
|---|---|---|---|---|---|---|---|
| Standard | 27.36 | 28.32 | 29.44 | 30.40 | 31.52 | 32.48 | 33.60 |
| Camarilla | 30.00 | 30.19 | 30.38 | 30.57 | 30.76 | 30.95 | 31.14 |
| Woodie | 27.45 | 28.36 | 29.53 | 30.44 | 31.61 | 32.52 | 33.69 |
| Fibonacci | 28.32 | 29.11 | 29.60 | 30.40 | 31.19 | 31.68 | 32.48 |
Numerical data
The following is the status of the technical indicators and moving averages at the time of publication of this technical analysis:
| RSI (14): | 54.63 | |
| MACD (12,26,9): | 0.2000 | |
| Directional Movement: | 4.33 | |
| AROON (14): | 28.57 | |
| DEMA (21): | 30.55 | |
| Parabolic SAR (0,02-0,02-0,2): | 29.61 | |
| Elder Ray (13): | 0.12 | |
| Super Trend (3,10): | 29.71 | |
| Zig ZAG (10): | 30.56 | |
| VORTEX (21): | 0.8500 | |
| Stochastique (14,3,5): | 67.15 | |
| TEMA (21): | 30.64 | |
| Williams %R (14): | -38.13 | |
| Chande Momentum Oscillator (20): | 0.83 | |
| Repulse (5,40,3): | 0.0900 | |
| ROCnROLL: | 1 | |
| TRIX (15,9): | 0.0600 | |
| Courbe Coppock: | 3.02 |
| MA7: | 30.68 | |
| MA20: | 30.23 | |
| MA50: | 30.06 | |
| MA100: | 29.42 | |
| MAexp7: | 30.58 | |
| MAexp20: | 30.32 | |
| MAexp50: | 29.98 | |
| MAexp100: | 29.33 | |
| Price / MA7: | -0.39% | |
| Price / MA20: | +1.09% | |
| Price / MA50: | +1.66% | |
| Price / MA100: | +3.87% | |
| Price / MAexp7: | -0.07% | |
| Price / MAexp20: | +0.79% | |
| Price / MAexp50: | +1.93% | |
| Price / MAexp100: | +4.19% |
News
The latest news and videos published on ICICI BANK LTD. at the time of the analysis were as follows:
- ICICI Bank enables NRI customers to use international mobile number to make UPI payments in India
- ICICI Bank enables NRI customers to use international mobile number to make UPI payments in India
- ICICI Bank Limited Files Annual Report on Form 20-F for Fiscal Year 2023
- ICICI Bank Limited Files Annual Report on Form 20-F for Fiscal Year 2022
- ICICI Bank Limited Files Annual Report in Form 20-F
About author
Online


Add a comment
Comments
0 comments on the analysis ICICI BANK LTD. - Daily