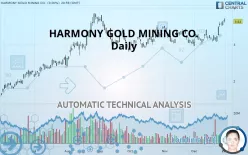
HARMONY GOLD MINING CO. - Daily - Technical analysis published on 01/02/2020 (GMT)
- 357
- 0
- Who voted?
Click here for a new analysis!
- Timeframe : Daily
- - Analysis generated on
- Status : TARGET REACHED

Summary of the analysis

Additional analysis
Quotes
HARMONY GOLD MINING CO. rating 3.63 USD. The price registered an increase of +0.00% on the session and was traded between 3.60 USD and 3.72 USD over the period. The price is currently at +0.83% from its lowest and -2.42% from its highest.The Central Gaps scanner detects a bullish gap which is a sign that buyers have taken the lead in the very short term.
Opening Gap UP
Type : Bullish
Timeframe : Openning
Here is a more detailed summary of the historical variations registered by HARMONY GOLD MINING CO.:
Near a new HIGH record (1 year)
Type : Bullish
Timeframe : Weekly
Near a new HIGH record (1st january)
Type : Bullish
Timeframe : Weekly
Near a new LOW record (1 month)
Type : Bearish
Timeframe : Weekly
Technical
A technical analysis in Daily of this HARMONY GOLD MINING CO. chart shows a strongly bullish trend. 92.86% of the signals given by moving averages are bullish. The overall trend is supported by the strong bullish signals from short-term moving averages. An assessment of moving averages reveals a bullish signal that could impact this trend:
Moving Average bullish crossovers : MA20 & MA50
Type : Bullish
Timeframe : Daily
In fact, 15 technical indicators on 18 studied are currently bullish. Caution: the Central Indicators scanner currently detects an excess:
CCI indicator is overbought : over 100
Type : Neutral
Timeframe : Daily
Williams %R indicator is overbought : over -20
Type : Neutral
Timeframe : Daily
Price is back over the pivot point
Type : Bullish
Timeframe : Daily
Price is back over the pivot point
Type : Bullish
Timeframe : Weekly
The analysis of the price chart with Central Patterns scanners does not return any result.
The Central Candlesticks scanner, specialised in Japanese candlesticks, did not identify any signals.
| S3 | S2 | S1 | Price | R1 | R2 | R3 | |
|---|---|---|---|---|---|---|---|
| ProTrendLines | 2.84 | 3.27 | 3.50 | 3.63 | 3.84 | 4.17 | 4.81 |
| Change (%) | -21.76% | -9.92% | -3.58% | - | +5.79% | +14.88% | +32.51% |
| Change | -0.79 | -0.36 | -0.13 | - | +0.21 | +0.54 | +1.18 |
| Level | Major | Major | Major | - | Major | Minor | Intermediate |
To determine price objectives, it is also possible to use the pivot points. Here is the price position in relation to pivot points:
| Pivot points | S3 | S2 | S1 | PP | R1 | R2 | R3 |
|---|---|---|---|---|---|---|---|
| Standard | 3.43 | 3.47 | 3.55 | 3.59 | 3.67 | 3.71 | 3.79 |
| Camarilla | 3.60 | 3.61 | 3.62 | 3.63 | 3.64 | 3.65 | 3.66 |
| Woodie | 3.45 | 3.48 | 3.57 | 3.60 | 3.69 | 3.72 | 3.81 |
| Fibonacci | 3.47 | 3.52 | 3.54 | 3.59 | 3.64 | 3.66 | 3.71 |
| Pivot points | S3 | S2 | S1 | PP | R1 | R2 | R3 |
|---|---|---|---|---|---|---|---|
| Standard | 2.66 | 2.87 | 3.22 | 3.42 | 3.77 | 3.98 | 4.33 |
| Camarilla | 3.42 | 3.47 | 3.52 | 3.57 | 3.62 | 3.67 | 3.72 |
| Woodie | 2.74 | 2.90 | 3.29 | 3.46 | 3.85 | 4.01 | 4.40 |
| Fibonacci | 2.87 | 3.08 | 3.21 | 3.42 | 3.63 | 3.77 | 3.98 |
| Pivot points | S3 | S2 | S1 | PP | R1 | R2 | R3 |
|---|---|---|---|---|---|---|---|
| Standard | 2.42 | 2.71 | 2.92 | 3.21 | 3.42 | 3.71 | 3.92 |
| Camarilla | 3.00 | 3.04 | 3.09 | 3.14 | 3.18 | 3.23 | 3.27 |
| Woodie | 2.39 | 2.69 | 2.89 | 3.19 | 3.39 | 3.69 | 3.89 |
| Fibonacci | 2.71 | 2.90 | 3.02 | 3.21 | 3.40 | 3.52 | 3.71 |
Numerical data
The following is the status of technical indicators and moving averages registered at the time this technical analysis was created:
| RSI (14): | 65.84 | |
| MACD (12,26,9): | 0.1000 | |
| Directional Movement: | 24.20 | |
| AROON (14): | 35.71 | |
| DEMA (21): | 3.44 | |
| Parabolic SAR (0,02-0,02-0,2): | 3.14 | |
| Elder Ray (13): | 0.26 | |
| Super Trend (3,10): | 3.23 | |
| Zig ZAG (10): | 3.63 | |
| VORTEX (21): | 1.0500 | |
| Stochastique (14,3,5): | 92.35 | |
| TEMA (21): | 3.53 | |
| Williams %R (14): | -13.85 | |
| Chande Momentum Oscillator (20): | 0.37 | |
| Repulse (5,40,3): | 3.5800 | |
| ROCnROLL: | 1 | |
| TRIX (15,9): | 0.1800 | |
| Courbe Coppock: | 20.33 |
| MA7: | 3.46 | |
| MA20: | 3.28 | |
| MA50: | 3.25 | |
| MA100: | 3.23 | |
| MAexp7: | 3.50 | |
| MAexp20: | 3.34 | |
| MAexp50: | 3.25 | |
| MAexp100: | 3.09 | |
| Price / MA7: | +4.91% | |
| Price / MA20: | +10.67% | |
| Price / MA50: | +11.69% | |
| Price / MA100: | +12.38% | |
| Price / MAexp7: | +3.71% | |
| Price / MAexp20: | +8.68% | |
| Price / MAexp50: | +11.69% | |
| Price / MAexp100: | +17.48% |
News
Don"t forget to follow the news on HARMONY GOLD MINING CO.. At the time of publication of this analysis, the latest news was as follows:
- New Research Coverage Highlights Universal Insurance Holdings, Harmony Gold Mining Company, Schweitzer-Mauduit International, U.S. Concrete, IPG Photonics, and Grupo Financiero Galicia S.A — Consolidated Revenues, Company Growth, and Expectations for 2018
-
 Harmony Gold Mining Company Limited - HMY Stock Chart Technical Analysis for 03-26-18
-
Harmony Gold Mining Company Limited - HMY Stock Chart Technical Analysis for 02-14-18
- Harmony Gold Mining Co. Ltd. Sponsored ADR to Host Earnings Call
- Harmony Gold Mining Company Ltd (JSE:HAR) Calgary Man to Sell the Only Solid Gold Replicas of Nelson Mandela's Hands Cast During His Lifetime
About author

Online


Add a comment
Comments
0 comments on the analysis HARMONY GOLD MINING CO. - Daily