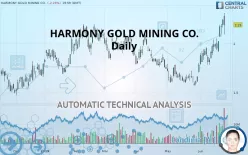
HARMONY GOLD MINING CO. - Daily - Technical analysis published on 06/26/2019 (GMT)
- 365
- 0
- Who voted?
Click here for a new analysis!
- Timeframe : Daily
- - Analysis generated on
- Status : TARGET REACHED

Summary of the analysis

Additional analysis
Quotes
The HARMONY GOLD MINING CO. rating is 2.19 USD. The price is lower by -2.23% since the last closing and was traded between 2.09 USD and 2.31 USD over the period. The price is currently at +4.78% from its lowest and -5.19% from its highest.The Central Gaps scanner detects the formation of a bullish gap marking the strong presence of buyers against sellers at the opening. This formed a quotation gap.
Opening Gap UP
Type : Bullish
Timeframe : Openning
So that you have an overall view of the price change, here is a table showing the variations over several periods:
New HIGH record (1 year)
Type : Bullish
Timeframe : Weekly
New HIGH record (1st january)
Type : Bullish
Timeframe : Weekly
New HIGH record (1 month)
Type : Bullish
Timeframe : Weekly
The Central Volumes scanner notes the presence of abnormal volumes:
Abnormal volumes
Timeframe : 5 days
Technical
Technical analysis of this Daily chart of HARMONY GOLD MINING CO. indicates that the overall trend is strongly bullish. The signals given by the moving averages are 89.29% bullish. This strong bullish trend is confirmed by the strong signals currently being given by short-term moving averages. There is no crossing of moving average by the price or crossing of moving averages between themselves.
The probability of a further increase is high given the direction of the technical indicators.
Caution: the Central Indicators scanner currently detects an excess:
RSI indicator is overbought : over 70
Type : Neutral
Timeframe : Daily
CCI indicator is overbought : over 100
Type : Neutral
Timeframe : Daily
Williams %R indicator is overbought : over -20
Type : Neutral
Timeframe : Daily
Price is back over the pivot point
Type : Bullish
Timeframe : Daily
Price is back over the pivot point
Type : Bullish
Timeframe : Weekly
Central Patterns, the market scanner focusing on chart patterns, resistances and supports found this result:
Resistance of channel is broken
Type : Bullish
Timeframe : Daily
The Central Candlesticks scanner, specialised in Japanese candlesticks, did not identify any signals.
| S3 | S2 | S1 | Price | R1 | R2 | R3 | |
|---|---|---|---|---|---|---|---|
| ProTrendLines | 1.69 | 1.92 | 2.15 | 2.19 | 2.48 | 2.95 | 3.42 |
| Change (%) | -22.83% | -12.33% | -1.83% | - | +13.24% | +34.70% | +56.16% |
| Change | -0.50 | -0.27 | -0.04 | - | +0.29 | +0.76 | +1.23 |
| Level | Minor | Major | Major | - | Minor | Intermediate | Minor |
Attention could also be paid to pivot points to set price objectives:
| Pivot points | S3 | S2 | S1 | PP | R1 | R2 | R3 |
|---|---|---|---|---|---|---|---|
| Standard | 2.09 | 2.13 | 2.18 | 2.22 | 2.27 | 2.31 | 2.36 |
| Camarilla | 2.22 | 2.22 | 2.23 | 2.24 | 2.25 | 2.26 | 2.26 |
| Woodie | 2.11 | 2.13 | 2.19 | 2.22 | 2.29 | 2.31 | 2.38 |
| Fibonacci | 2.13 | 2.16 | 2.18 | 2.22 | 2.25 | 2.27 | 2.31 |
| Pivot points | S3 | S2 | S1 | PP | R1 | R2 | R3 |
|---|---|---|---|---|---|---|---|
| Standard | 1.70 | 1.80 | 1.99 | 2.09 | 2.28 | 2.38 | 2.57 |
| Camarilla | 2.09 | 2.12 | 2.14 | 2.17 | 2.20 | 2.22 | 2.25 |
| Woodie | 1.74 | 1.82 | 2.03 | 2.11 | 2.32 | 2.40 | 2.61 |
| Fibonacci | 1.80 | 1.91 | 1.98 | 2.09 | 2.20 | 2.27 | 2.38 |
Numerical data
The following are the details of the technical indicators and moving averages that were collected to generate this technical analysis:
| RSI (14): | 70.33 | |
| MACD (12,26,9): | 0.1100 | |
| Directional Movement: | 19.72 | |
| AROON (14): | 71.43 | |
| DEMA (21): | 2.10 | |
| Parabolic SAR (0,02-0,02-0,2): | 2.02 | |
| Elder Ray (13): | 0.16 | |
| Super Trend (3,10): | 1.91 | |
| Zig ZAG (10): | 2.19 | |
| VORTEX (21): | 1.1500 | |
| Stochastique (14,3,5): | 89.36 | |
| TEMA (21): | 2.20 | |
| Williams %R (14): | -22.64 | |
| Chande Momentum Oscillator (20): | 0.30 | |
| Repulse (5,40,3): | 2.3000 | |
| ROCnROLL: | 1 | |
| TRIX (15,9): | 0.6500 | |
| Courbe Coppock: | 34.62 |
| MA7: | 2.10 | |
| MA20: | 1.93 | |
| MA50: | 1.80 | |
| MA100: | 1.90 | |
| MAexp7: | 2.12 | |
| MAexp20: | 1.97 | |
| MAexp50: | 1.88 | |
| MAexp100: | 1.86 | |
| Price / MA7: | +4.29% | |
| Price / MA20: | +13.47% | |
| Price / MA50: | +21.67% | |
| Price / MA100: | +15.26% | |
| Price / MAexp7: | +3.30% | |
| Price / MAexp20: | +11.17% | |
| Price / MAexp50: | +16.49% | |
| Price / MAexp100: | +17.74% |
News
The last news published on HARMONY GOLD MINING CO. at the time of the generation of this analysis was as follows:
- New Research Coverage Highlights Universal Insurance Holdings, Harmony Gold Mining Company, Schweitzer-Mauduit International, U.S. Concrete, IPG Photonics, and Grupo Financiero Galicia S.A — Consolidated Revenues, Company Growth, and Expectations for 2018
-
 Harmony Gold Mining Company Limited - HMY Stock Chart Technical Analysis for 03-26-18
-
Harmony Gold Mining Company Limited - HMY Stock Chart Technical Analysis for 02-14-18
- Harmony Gold Mining Co. Ltd. Sponsored ADR to Host Earnings Call
- Harmony Gold Mining Company Ltd (JSE:HAR) Calgary Man to Sell the Only Solid Gold Replicas of Nelson Mandela's Hands Cast During His Lifetime
About author

Online


Add a comment
Comments
0 comments on the analysis HARMONY GOLD MINING CO. - Daily