HONDA MOTOR CO. - 1H - Technical analysis published on 03/21/2025 (GMT)
- 91
- 0
- Timeframe : 1H
- - Analysis generated on
- Status : IN PROGRESS...

Summary of the analysis

Additional analysis
Quotes
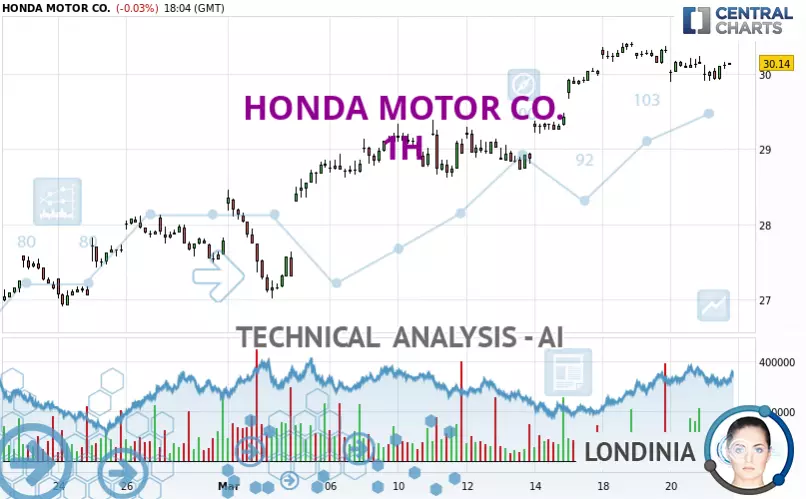
The HONDA MOTOR CO. price is 30.14 USD. On the day, this instrument lost -0.03% with the lowest point at 29.90 USD and the highest point at 30.15 USD. The deviation from the price is +0.80% for the low point and -0.03% for the high point.So that you have an overall view of the price change, here is a table showing the variations over several periods:
Near a new HIGH record (1st january)
Type : Bullish
Timeframe : Weekly
Near a new HIGH record (1 month)
Type : Bullish
Timeframe : Weekly
Technical
Technical analysis of this 1H chart of HONDA MOTOR CO. indicates that the overall trend is strongly bullish. 82.14% of the signals given by moving averages are bullish. The slightly bullish signals given by the short-term moving averages show a weakening of the global trend. The Central Indicators scanner detects a bullish signal on moving averages that could impact this trend:
Bullish trend reversal : adaptative moving average 20
Type : Bullish
Timeframe : 1 hour
In fact, according to the parameters integrated into the Central Analyzer system, only 7 technical indicators out of 18 analysed are currently bullish. Other results related to technical indicators were also found by the Central Indicators scanner:
Pivot points : price is over resistance 2 (Daily)
Type : Neutral
Timeframe : Weekly
Pivot points : price is over resistance 2 (Weekly)
Type : Neutral
Timeframe : 1 hour
Pivot points : price is over resistance 2 (Monthly)
Type : Neutral
Timeframe : 1 hour
The Central Patterns scanner, which studies chart patterns, resistances and supports, has identified this signal:
Near horizontal resistance
Type : Bearish
Timeframe : 1 hour
The Central Candlesticks scanner, specialised in Japanese candlesticks, did not identify any signals.
| S3 | S2 | S1 | Price | R1 | R2 | R3 | |
|---|---|---|---|---|---|---|---|
| ProTrendLines | 28.12 | 28.74 | 29.39 | 30.14 | 30.29 | 31.97 | 33.29 |
| Change (%) | -6.70% | -4.64% | -2.49% | - | +0.50% | +6.07% | +10.45% |
| Change | -2.02 | -1.40 | -0.75 | - | +0.15 | +1.83 | +3.15 |
| Level | Minor | Intermediate | Major | - | Major | Major | Major |
To determine price objectives, it is also possible to use the pivot points. Here is the price position in relation to pivot points:
| Pivot points | S3 | S2 | S1 | PP | R1 | R2 | R3 |
|---|---|---|---|---|---|---|---|
| Standard | 29.61 | 29.75 | 29.95 | 30.09 | 30.29 | 30.43 | 30.63 |
| Camarilla | 30.06 | 30.09 | 30.12 | 30.15 | 30.18 | 30.21 | 30.24 |
| Woodie | 29.64 | 29.77 | 29.98 | 30.11 | 30.32 | 30.45 | 30.66 |
| Fibonacci | 29.75 | 29.88 | 29.96 | 30.09 | 30.22 | 30.30 | 30.43 |
| Pivot points | S3 | S2 | S1 | PP | R1 | R2 | R3 |
|---|---|---|---|---|---|---|---|
| Standard | 28.01 | 28.31 | 28.87 | 29.17 | 29.73 | 30.03 | 30.59 |
| Camarilla | 29.18 | 29.26 | 29.34 | 29.42 | 29.50 | 29.58 | 29.66 |
| Woodie | 28.13 | 28.38 | 28.99 | 29.24 | 29.85 | 30.10 | 30.71 |
| Fibonacci | 28.31 | 28.64 | 28.85 | 29.17 | 29.50 | 29.71 | 30.03 |
| Pivot points | S3 | S2 | S1 | PP | R1 | R2 | R3 |
|---|---|---|---|---|---|---|---|
| Standard | 23.88 | 25.14 | 26.47 | 27.73 | 29.06 | 30.32 | 31.65 |
| Camarilla | 27.08 | 27.32 | 27.55 | 27.79 | 28.03 | 28.27 | 28.50 |
| Woodie | 23.91 | 25.16 | 26.50 | 27.75 | 29.09 | 30.34 | 31.68 |
| Fibonacci | 25.14 | 26.13 | 26.74 | 27.73 | 28.72 | 29.33 | 30.32 |
Numerical data
The following are the details of the technical indicators and moving averages that were collected to generate this technical analysis:
| RSI (14): | 54.92 | |
| MACD (12,26,9): | 0.0500 | |
| Directional Movement: | 0.19 | |
| AROON (14): | -7.14 | |
| DEMA (21): | 30.18 | |
| Parabolic SAR (0,02-0,02-0,2): | 30.17 | |
| Elder Ray (13): | 0.01 | |
| Super Trend (3,10): | 30.43 | |
| Zig ZAG (10): | 30.14 | |
| VORTEX (21): | 1.0100 | |
| Stochastique (14,3,5): | 34.38 | |
| TEMA (21): | 30.05 | |
| Williams %R (14): | -48.96 | |
| Chande Momentum Oscillator (20): | -0.17 | |
| Repulse (5,40,3): | 0.5600 | |
| ROCnROLL: | 1 | |
| TRIX (15,9): | 0.0500 | |
| Courbe Coppock: | 1.19 |
| MA7: | 29.89 | |
| MA20: | 28.79 | |
| MA50: | 28.43 | |
| MA100: | 27.82 | |
| MAexp7: | 30.08 | |
| MAexp20: | 30.08 | |
| MAexp50: | 29.80 | |
| MAexp100: | 29.32 | |
| Price / MA7: | +0.84% | |
| Price / MA20: | +4.69% | |
| Price / MA50: | +6.01% | |
| Price / MA100: | +8.34% | |
| Price / MAexp7: | +0.20% | |
| Price / MAexp20: | +0.20% | |
| Price / MAexp50: | +1.14% | |
| Price / MAexp100: | +2.80% |
News
Don't forget to follow the news on HONDA MOTOR CO.. At the time of publication of this analysis, the latest news was as follows:
- Honda Selected as a CDP "Climate Change A List" Company for Second Consecutive Year
- Honda Receives Highest Ranking of 3 Stars as Part of FIA Road Safety Index, Tool for Organizations and Companies to Measure Their Road Safety Footprint
- Honda Partners with United Nations Road Safety Fund (UNRSF) to Work Toward Reduction of Fatalities from Traffic Collisions
- Honda Reveals Specification for its Next-generation Fuel Cell Module
- FLAT OUT IN TOKYO "Red Bull Showrun x Powered by Honda" April 2 (Wed)
About author
Online


Add a comment
Comments
0 comments on the analysis HONDA MOTOR CO. - 1H