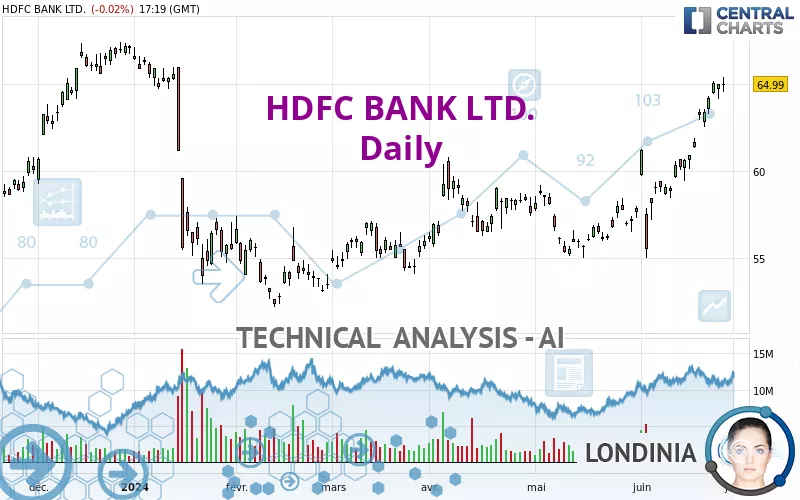
HDFC BANK LTD. - Daily - Technical analysis published on 06/27/2024 (GMT)
- 152
- 0
Click here for a new analysis!
- Timeframe : Daily
- - Analysis generated on
- Status : INVALID

Summary of the analysis

Additional analysis
Quotes
The HDFC BANK LTD. price is 64.99 USD. The price is lower by -0.02% since the last closing and was between 64.53 USD and 65.42 USD. This implies that the price is at +0.71% from its lowest and at -0.66% from its highest.So that you have an overall view of the price change, here is a table showing the variations over several periods:
Near a new HIGH record (1st january)
Type : Bullish
Timeframe : Weekly
New HIGH record (1 month)
Type : Bullish
Timeframe : Weekly
Technical
A technical analysis in Daily of this HDFC BANK LTD. chart shows a strongly bullish trend. 92.86% of the signals given by moving averages are bullish. This strongly bullish trend is supported by the strong bullish signals given by short-term moving averages. The Central Indicators scanner does not detect any result on moving averages that would impact this trend.
In fact, 13 technical indicators on 18 studied are currently positioned bullish. Caution: the Central Indicators scanner currently detects an excess:
RSI indicator is overbought : over 70
Type : Neutral
Timeframe : Daily
CCI indicator is overbought : over 100
Type : Neutral
Timeframe : Daily
Williams %R indicator is overbought : over -20
Type : Neutral
Timeframe : Daily
Pivot points : price is over resistance 1
Type : Neutral
Timeframe : Weekly
The Central Patterns scanner, which studies chart patterns, resistances and supports, has identified these signals:
Near horizontal resistance
Type : Bearish
Timeframe : Daily
Resistance of channel is broken
Type : Bullish
Timeframe : Daily
The Central Candlesticks scanner which studies Japanese candlesticks did not detect anything.
| S3 | S2 | S1 | Price | R1 | R2 | R3 | |
|---|---|---|---|---|---|---|---|
| ProTrendLines | 58.62 | 61.23 | 63.74 | 64.99 | 66.41 | 70.51 | 77.11 |
| Change (%) | -9.80% | -5.79% | -1.92% | - | +2.18% | +8.49% | +18.65% |
| Change | -6.37 | -3.76 | -1.25 | - | +1.42 | +5.52 | +12.12 |
| Level | Major | Intermediate | Intermediate | - | Intermediate | Major | Minor |
Attention could also be paid to pivot points to set price objectives:
| Pivot points | S3 | S2 | S1 | PP | R1 | R2 | R3 |
|---|---|---|---|---|---|---|---|
| Standard | 63.52 | 63.83 | 64.41 | 64.72 | 65.30 | 65.61 | 66.19 |
| Camarilla | 64.76 | 64.84 | 64.92 | 65.00 | 65.08 | 65.16 | 65.25 |
| Woodie | 63.67 | 63.90 | 64.56 | 64.79 | 65.45 | 65.68 | 66.34 |
| Fibonacci | 63.83 | 64.17 | 64.38 | 64.72 | 65.06 | 65.27 | 65.61 |
| Pivot points | S3 | S2 | S1 | PP | R1 | R2 | R3 |
|---|---|---|---|---|---|---|---|
| Standard | 57.69 | 58.90 | 61.16 | 62.37 | 64.63 | 65.84 | 68.10 |
| Camarilla | 62.46 | 62.77 | 63.09 | 63.41 | 63.73 | 64.05 | 64.36 |
| Woodie | 58.21 | 59.16 | 61.68 | 62.63 | 65.15 | 66.10 | 68.62 |
| Fibonacci | 58.90 | 60.23 | 61.05 | 62.37 | 63.70 | 64.52 | 65.84 |
| Pivot points | S3 | S2 | S1 | PP | R1 | R2 | R3 |
|---|---|---|---|---|---|---|---|
| Standard | 52.26 | 53.62 | 55.76 | 57.12 | 59.26 | 60.62 | 62.76 |
| Camarilla | 56.93 | 57.25 | 57.57 | 57.89 | 58.21 | 58.53 | 58.85 |
| Woodie | 52.64 | 53.82 | 56.14 | 57.32 | 59.64 | 60.82 | 63.14 |
| Fibonacci | 53.62 | 54.96 | 55.79 | 57.12 | 58.46 | 59.29 | 60.62 |
Numerical data
The following is the status of technical indicators and moving averages registered at the time this technical analysis was created:
| RSI (14): | 73.30 | |
| MACD (12,26,9): | 1.9800 | |
| Directional Movement: | 21.49 | |
| AROON (14): | 78.57 | |
| DEMA (21): | 63.83 | |
| Parabolic SAR (0,02-0,02-0,2): | 59.44 | |
| Elder Ray (13): | 2.41 | |
| Super Trend (3,10): | 61.45 | |
| Zig ZAG (10): | 64.96 | |
| VORTEX (21): | 1.0500 | |
| Stochastique (14,3,5): | 96.27 | |
| TEMA (21): | 65.02 | |
| Williams %R (14): | -6.50 | |
| Chande Momentum Oscillator (20): | 5.88 | |
| Repulse (5,40,3): | 2.0600 | |
| ROCnROLL: | 1 | |
| TRIX (15,9): | 0.3700 | |
| Courbe Coppock: | 18.82 |
| MA7: | 63.93 | |
| MA20: | 60.82 | |
| MA50: | 58.45 | |
| MA100: | 56.64 | |
| MAexp7: | 63.87 | |
| MAexp20: | 61.47 | |
| MAexp50: | 59.22 | |
| MAexp100: | 58.42 | |
| Price / MA7: | +1.66% | |
| Price / MA20: | +6.86% | |
| Price / MA50: | +11.19% | |
| Price / MA100: | +14.74% | |
| Price / MAexp7: | +1.75% | |
| Price / MAexp20: | +5.73% | |
| Price / MAexp50: | +9.74% | |
| Price / MAexp100: | +11.25% |
News
The latest news and videos published on HDFC BANK LTD. at the time of the analysis were as follows:
- HDFC Bank Limited 20-F Available Online
- HDFC Bank partners with Ascenda to amplify cards value proposition
- HDFC Bank partners with Ascenda to amplify cards value proposition
- HDFC Bank Limited 20-F Available Online
- HDFC Bank Limited 20-F Available Online
About author
Online


Add a comment
Comments
0 comments on the analysis HDFC BANK LTD. - Daily